Secured Communication for Hacker Activists and Liberals

Does the NSA track Git requests. I mean can’t the terrorists just be talking to each other by Visual Cryptography of Arabic through Git Repo requests.

Basically increase the cost of decryption.

vispixel

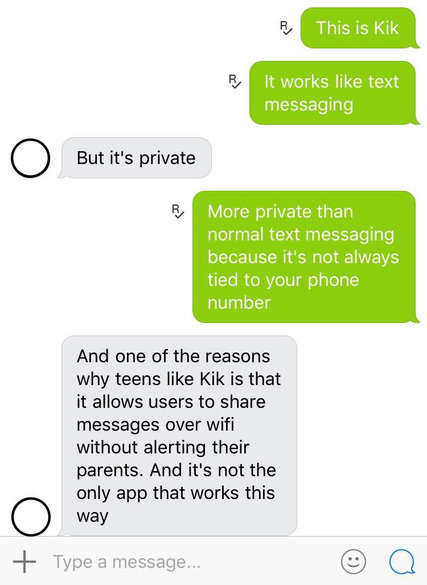
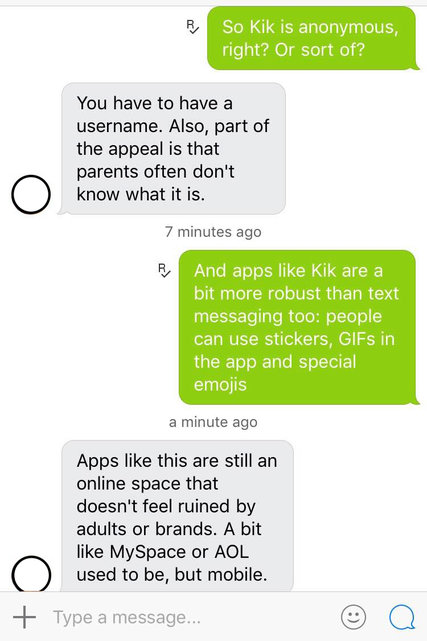
This is Visual Cryptography. Now Imagine using a one time pad codebook of just emojis and talking through mobile and Kik.

Etherpad is a highly customizable Open Source online editor providing collaborative editing in really real-time

Think of it as Kik for laptops.

06kik-ss1-blog427-v206kik-ss2-blog427-v2

Unfortunately NSA killed Waste Again

What is “WASTE again”?

“WASTE again” enables you to create a decentralized and secure private mesh network using an unsecure network, such as the internet. Once the public encryption keys are exchanged, sending messages, creating groupchats and transferring files is easy and secure.

Creating a mesh

To create a mesh you need at least two computers with “WASTE again” installed. During installation, a unique pair of public and private keys for each computer is being generated. Before the first connection can be established, you need to exchange these public keys. These keys enable “WASTE again” to authenticate every connection to other “WASTE again” clients.

After exchanging the keys, you simply type in the computers IP address to connect to. If that computer is located behind a firewall or a NAT-router, you have to create a portmap first to enable incoming connections.

At least one computer in your mesh has to be able to accept incoming connections, making it a “public node”. If no direct connection between two firewalled computers can be made, “WASTE again” automatically routes your traffic through one or more of the available public nodes.

Every new node simply has to exchange keys with one of the connected nodes and then connect to it. All the other nodes will exchange their keys automatically over the mesh.

Google Drive safety for government as well as corporate espionage.

Post Snowden- we know that that company cofounded by a Russian Jewish immigrant went back on those very core values and helped create a benign version of the KGB. So you run away from Russia because hey the State is monitoring everything and then you refuse to stop your company from helping the new country’s government to do exactly the same. Google’s post snowden loss of credibility should make businesses think whether Microsoft Exchange servers are more secure than Google’s. Atleast Microsoft offers no – Dont be Evil Hypocricy”

Chinese hackers  are just a Google bogey. Pakistani Intelligence ISI helping ISIS with ideas and consulting is what is the real threat. Too bad, we were too busy creating algorithms to click more ads.

The TOR- ONION Project is more like the ONION comedy thanks to its proliferation of NSA nodes.


The Tree of Liberty needs to be watered with the blood of patriotic cryptographers not accepting easy money but staying true to the ideals of a public free from espionage from Government with the fourth amendment rights secured digitally as well.

Lost in New York : A R Writer uses code to analyze

I was in New York for past two days. New York is very pretty, very cold and the trains are very confusing. So I ended up walking and going back and forth.

Later on, when I reached home, heat, food, bed and jet lag, I decided to analyze where and what did I see in the visual ephiphany tour.

This was my route

Screenshot from 2016-02-10 06:13:03

This was my R code

library(jsonlite)
a=fromJSON("/home/ajay/Desktop/Takeout/Location History/LocationHistory.json")
b=as.data.frame(a)
 
mygoog=NULL
mygoog$latitude=b$locations.latitudeE7/10000000
mygoog$longitude=b$locations.longitudeE7/10000000
mygoog$time=as.POSIXct(as.numeric(b$locations.timestampMs)/1000 , origin="1970-01-01")
 
 
mygoog=as.data.frame(mygoog)
head(mygoog)
nrow(mygoog)
#Clearly that is over the API limit for free usage
length(unique(mygoog$longitude))
library(magrittr) #to make code easier to read
mygoog$longitude%>%unique%>%length
unique(mygoog$latitude)
mygoog$latitude%>%unique%>%length
 
fivenum(mygoog$latitude) #tukey
 
#or using Dr H over Tukey
library(Hmisc)
describe(mygoog$latitude)
describe(mygoog$longitude)
 
#deleting Non NY data
mygoog2=mygoog[mygoog$longitude<0,]
describe(mygoog2$longitude)
rm(mygoog2)
mygoog2=mygoog[mygoog$latitude<48,]
describe(mygoog2$latitude)
rm(mygoog2)
 
mygoog=mygoog[mygoog$longitude<0&mygoog$latitude<48,]
 
 
library(ggmap)=
#Starting Point
revgeocode(c(mygoog$longitude[1],mygoog$latitude[1]))
#Starting Time
mygoog$time[1]
------
  #Median Location
a1=median(mygoog$longitude)
print(a1)
a2=median((mygoog$latitude))
print(a2)
revgeocode(c(a1,a2))
 
#Lingering Location
Mode <- function(x) {
  ux <- unique(x)
  ux[which.max(tabulate(match(x, ux)))]
}
b1=Mode(mygoog$longitude)
b1
b2=Mode(mygoog$latitude)
b2
 
revgeocode(c(b1,b2))
#Creating New Fields to minimize API calls to Google Maps
unique(mygoog$longitude)
unique(mygoog$latitude)
 mygoog2=mygoog[!duplicated(mygoog[c("longitude", "latitude")]),]
nrow(mygoog2)
 
result <- do.call(rbind,
                  lapply(1:nrow(mygoog2),
                         function(i)revgeocode(as.numeric(mygoog2[i,1:2]))))
mygoog2 <- cbind(mygoog2,result)
 
library(stringr)
mygoog2$zipcode <- substr(str_extract(mygoog2$result," [0-9]{5}, .+"),2,6)
mygoog2[,-4]
 
#merge(x, y, by=c("k1","k2")) # NA's match
 
#Cleaning up workspace
             #rm(a1)
             #rm(a2)
             #gc()
 
Map <- get_googlemap(center = c(lon = median(mygoog$longitude), lat = median(mygoog$latitude)),
                     zoom = 13, 
                     size = c(640, 640), 
                     scale = 2, maptype = c("terrain"), 
                     color = "color")
 
plot1 <- ggmap(Map) + 
  geom_path(data = mygoog, aes(x = longitude, y = latitude
  ), 
  alpha = I(0.9), 
  size = 1.8)
suppressWarnings(print(plot1))

Code contains Easter Eggs created by Pretty R at inside-R.org

Dr Eric Siegel updates popular book on Predictive Analytics

Dr Eric Siegel has just released the updated version of his very popular book on Predictive Analytics, Predictive Analytics: The Power to Predict Who Will Click, Buy, Lie, or Die

at http://www.predictiveanalyticsworld.com/book/overview.php

The book which is a bestseller in many categories on Amazon has met with overwhelming praise from industry. One of the reasons is that it is chockablock with real case studies that make it much more easy to learn and execute predictive analytics. I frequently recommend it as an additional book when I am teaching data science online. Here is the link to my 2013 review of the earlier edition

https://decisionstats.com/2013/02/25/book-review-predictive-analytics-the-power-to-predict-who-will-click-buy-lie-or-die/

9781119145677.pdf


Blogging Conflict of Interest Disclaimer – The book author is also founder of Predictive Analytics Conference, a sponsor of this site since many years.

Analyze Wireshark Data in R

Wireshark is the world’s foremost network protocol analyzer. It lets you see what’s happening on your network at a microscopic level. It is the de facto (and often de jure) standard across many industries and educational institutions.

INSTALL 

First, we install Wireshark from the terminal.


Source-

http://www.dickson.me.uk/2012/09/17/installing-wireshark-on-ubuntu-12-04-lts/


CAPTURE

Type wireshark from terminal.Screenshot from 2016-01-08 16:43:46

Start capture by looking at Capture Tab and interfaces

Screenshot from 2016-01-08 16:44:34


Export data as a csvScreenshot from 2016-01-08 16:45:41

ANALYZE

Import file in R to analyze

(from http://www.statmethods.net/input/importingdata.html )

Slideshare for DataScience

I increasingly use Slideshare since the past few years for dumping my Presentations or material I read and want to  share. While Google Docs remains my tool of choice for making Presentations, Slideshare.net is just a one click upload and gets a wide audience for my presentations. I also like just browsing through for stuff as in http://www.slideshare.net/featured/category/data-analytics or searchingScreenshot from 2016-01-02 20:35:53

Plus I can embed it a much easier to read format for a ready to go blog post. Even my latest slideshare on a Py data science tutorial got 8000+ views in a single week ( of Christmas … hmm)


These are my stats (all time and last year). You can get yours at http://www.slideshare.net/insight

Screenshot from 2016-01-02 20:33:33

Screenshot from 2016-01-02 20:33:56


2015

We got the maximum number of views in Year 8 of DecisionStats. Created in 2007, with 191,000 views DecisionStats continues to be one of the largest single author blogs in open source data science.

This year we began our dalliance with Pythonic power.

With the seventh year itch firmly behind us, lets have a rocking 2016. Lets be more honest in 2016!!!

I would like to thank the readers, all 131,258 of you 😉

and the sponsors, Predictive Analytics Conference.


Screenshot from 2016-01-01 13:16:01