Will Rio Olympics be like Munich

The continued inability of American led IC to decrypt , intercept and predict extreme events associated with the assholes known as ISIS- leads one to wonder if Big Data,  Data Science and Complex Event Processing can ever come in time to easy to use interfaces. Analysts are currently on overworked scrambled mode, and so are law enforcement while sleeper agents of ISIS sleep.

The targeted events of California (Pakistani Shooter), Paris (ISIS bombers-shooters), Belgium (continued) and Orlando (Afghan origin shooter) suggest terrorism communication has evolved or are using freelance agents from multiple sources. While Communist Russia used to provide freelance advice to terrorism in the past, and Pakistanis have been master in low intensity terror led assymetric warfare, one can only shudder if Intelligence can evolve in time as Terror. or Does Eisenhower’s famous remark on the military industrial complex suggest- USA needs another Nobel PEace Prize winner and a war to justify it

Will the 5 eyes ( America , Canada, Australia, UK, et al) ever take help from the rest of the free world. Or is Presidential ego in building a bigger library bigger than the need for a clean Olympics

Complex event processing, or CEP, is event processing that combines data from multiple sources to infer events or patterns that suggest more complicated circumstances. The goal of complex event processing is to identify meaningful events (such as opportunities or threats) and respond to them as quickly as possible.

Related- Time Series Analysis of Complex Events and Signal/Noise Ratio Evolution

The Battle of Badr On 17 Ramadan

https://www.facebook.com/notes/maktab-channel/the-battle-of-badr-on-17-ramadan/239795319392896/

A New York Hackthon

I was asked to be a replacement judge for The FinTech City that Never Sleeps hackathon! This two day hackathon took place on Friday to Saturday in New York . It was brought by a startup accelator Startupbootcamp FinTech New York (@sbcFinTech) and sponsored by Byte Academy

 (Blogger conflict of interest disclaimer- I briefly advised one of the startups at Startupbootcamp for two weeks in data science and I gave a couple of free talks at meetups organized by Byte Academy)

Overall the theme of this hackathon was how to use innovation in technology for the biggest industry in New York (finance). Ergo the curious but rather catchy term fintech. Technology in Finance! Wall Street for the good of main street! One curious and common refrain was how millennials trust their mobile and Uber more than Banks or financial advisors.

My observations were- engineering talent in New York continues to lag behind California. Access to both money and design  makes New York a serious contender for usurping Silicon Valley’s mountain glory.

A serious advantage New York has over California is water. A serious advantage California has over New York is the sunlight.

The hacking kids in this hackathon were bright and innovative. Hacking is both a social experiment as well as practical need to think and innovate in stagnant industries like Finance, Fashion , Theatre, Social Empowerment and Entertainment. A healthy dose of reality shall ensure hackathons become the new more productive passtime of the children of America.  Star Trek Next Generation!

This one man team /guy won the best technical award and took all his prizes.

IMG_7998

The judges pose

IMG_8003

These guys (ideal karma !) won the overall hackathon

Screenshot from 2016-06-16 12:47:53


For details see http://www.eventbrite.com/e/the-fintech-city-that-never-sleeps-hackathon-tickets-25550744966 or more tweets me at https://twitter.com/holydatascience


I really enjoyed judging the hackthon in New York, which ironically is still my favourite city because of the libraries, trees and well pretty people besides the lovely Hudson in the summer.  It was nice to be back in New York since 2009 when I came over for the first Big Data meeting ( by AsterData later acquired by Teradata).

Afterthought- What is built by a human can be and should be hacked by another human. That is the only way we are going to be continuously improving as a species and as one world. Hacking is important to simplify a complex world where resources are precious and the costs of error huge 


Living with BiPolar Disorder

A close friend of mine recently discovered that she had bipolar disorder. It is a difficult to diagnose disability, and living in India added to both the complexity of diagnosis and treatment. Given the states of high, low, psychotic episodes that bipolar have, in a pseudo conservative society like India brought me to the still humbling fact that more data scientists chase how to make ad clicks better than how to study brain imaging data and more money is spent making Hollywood movies than chasing climate change, Mars, or brain imaging. As the Joker said, everybody loses their mind if one little surprise is given, even to budgeting and funding across the world for healthcare.

Anyways, my friend is back on her feet and doing well with yoga. Yoga can help aid mental disabilities at lower costs, but lol, wait till you have FDA approval for asanas

Spring Cleaning – What I wrote


A partial list of writings by me over the years


  • Big Data Initiatives in Developing Nations


Can big data, open data, and programs such as the Aadhaar Project enhance lives in underprivileged segments of society? March 2015

http://www.ibmbigdatahub.com/blog/big-data-initiatives-developing-nations

2) Downsides Dampen Open-Source Analytics September 2011 http://www.allanalytics.com/author.asp?section_id=1408&doc_id=233454


3) KDNuggets – Articles on Data Science


  1. Using Python and R together: 3 main approaches December 2015


  1. Interview: Ingo Mierswa, RapidMiner CEO on “Predaction” and Key Turning Points  June 2014
  2. Guide to Data Science Cheat Sheets 2014/05/12
  3. Book Review: Data Just Right 2014/04/03
  4. Exclusive Interview: Richard Socher, founder of etcML, Easy Text Classification Startup 2014/03/31
  5. Trifacta – Tackling Data Wrangling with Automation and Machine Learning 2014/03/17
  6. Paxata automates Data Preparation for Big Data Analytics 2014/03/07
  7. etcML Promises to Make Text Classification Easy  2014/03/05
  8. Wolfram Breakthrough Knowledge-based Programming Language – what it means for Data Science? 2014/03/02

Programmable Web- Articles on APIs


  1. Keen IO Helps Developers Solve Custom Analytics Needs 06-09-2014
  2. Scoreoid Aims to Gamify the World Using APIs 01-27-2014
  3. Plot.ly’s Plot to Visualize More Data 01-22-2014
  4. LumenData’s Acquisition of Algorithms.io is a Win-Win 01-08-2014
  5. Yactraq API Sees Huge Growth in 2013 01-06-2014
  6. Scrape.it Describes a Better Way to Extract Data12-20-2013
  7. Exclusive Interview: App Store Analytics API 12-04-2013
  8. APIs Enter 3d Printing Industry 11-29-2013
  9. PW Interview: José Luis Martinez of Textalytics 11-06-2013
  10. PW Interview Simon Chan PredictionIO 11-05-2013
  11. PW Interview: Scott Gimpel Founder and CEO FantasyData.com 10-23-2013
  12. PW Interview Brandon Levy, cofounder and CEO of Stitch Labs 10-08-2013
  13. PW Interview: Jolo Balbin Co-Founder Text Teaser 09-18-2013
  14. PW Interview:Bob Bickel CoFounder Redline13 07-29-2013
  15. PW Interview : Brandon Wirtz CTO Stremor.com 07-04-2013
  16. PW Interview: Andy Bartley, CEO Algorithms.io 06-04-2013
  17. PW Interview: Francisco J Martin, CEO BigML.com 05-30-2013
  18. PW Interview: Tal Rotbart Founder- CTO, SpringSense 05-28-2013
  19. PW Interview: Jeh Daruwala CEO Yactraq API, Behavorial Targeting for videos 05-13-2013
  20. PW Interview: Michael Schonfeld of Dwolla API on Innovation Meeting the Payment Web 05-02-2013
  21. PW Interview: Stephen Balaban of Lamda Labs on the Face Recognition API 04-29-2013
  22. PW Interview: Amber Feng, Stripe API, The Payment Web 04-24-2013
  23. PW Interview: Greg Lamp and Austin Ogilvie of Yhat on Shipping Predictive Models via API 04-22-2013
  24. Google Mirror API documentation is open for developers 04-18-2013
  25. PW Interview: Ricky Robinett, Ordr.in API, Ordering Food meets API 04-16-2013
  26. PW Interview: Jacob Perkins, Text Processing API, NLP meets API 04-10-2013
  27. Amazon EC2 On Demand Windows Instances -Prices reduced by 20% 04-08-2013
  28. Amazon S3 API Requests prices slashed by half 04-03-2013
  29. PW Interview: Stuart Battersby, Chatterbox API, Machine Learning meets Social 04-02-2013
  30. PW Interview: Karthik Ram, rOpenSci, Wrapping all science APIs 03-20-2013
  31. Viralheat Human Intent API- To buy or not to buy 03-13-2013
  32. Interview Tammer Kamel CEO and Founder Quandl 03-07-2013
  33. YHatHQ API: Calling Hosted Statistical Models 03-04-2013
  34. Quandl API: A Wikipedia for Numerical Data 02-25-2013
  35. Amazon Redshift API is out of limited preview and available! 02-18-2013
  36. Windows Azure Media Services REST API 02-14-2013
  37. Data Science Toolkit Wraps Many Data Services in One API 02-11-2013
  38. Diving into Codeacademy’s API Lessons 01-31-2013
  39. Google APIs finetuning Cloud Storage JSON API 01-29-2013
  40. Interview Hilary Mason Chief Scientist bitly 01-28-2013
  41. Interview: Viralheat CEO Raj Kadam on API Growth 01-22-2013
  42. Google Compute API – Affordable Computing at Google Scale 01-17-2013
  43. Ergast API Puts Car Racing Fans in the Driver’s Seat12-05-2012
  44. Springer APIs- Fostering Innovation via API Contests 11-20-2012
  45. Statistically programming the web – Shiny,HttR and RevoDeploy API 11-19-2012
  46. Google Cloud SQL API- Bigger ,Faster and now Free 11-12-2012
  47. A Look at the Web’s Most Popular API -Google Maps API 10-09-2012
  48. Cloud Storage APIs for the next generation Enterprise 09-26-2012
  49. Last.fm API: Sultan of Musical APIs 09-12-2012
  50. Socrata Data API: Keeping Government Open 08-29-2012
  51. BigML API Gets Bigger 08-22-2012
  52. Bing APIs: the Empire Strikes Back 08-15-2012
  53. Google Cloud SQL: Relational Database on the Cloud 08-13-2012
  54. Google BigQuery API Makes Big Data Analytics Easy 08-07-2012
  55. Your Store in The Cloud -Google Cloud Storage API 08-01-2012
  56. Predict the future with Google Prediction API 07-30-2012
  57. The Romney vs Obama API 07-27-2012


StatisticsViews

http://www.statisticsviews.com/details/feature/8868901/A-Tutorial-on-Python.html


CONFERENCES AND TALKS

1) Big Data Big Analyticshttp://krishnarajpm.com/bigdata/abstract.pdf Workshop on  Statistical Machine Learning and Game Theory  Approaches for Large Scale Data Analysis  9 July 2012 – 14 July 2012  Sponsored by Mathematical Sciences, Division of Science and Engineering  Research Board at Bangalore India

Department of Science & Technology Government of India. (sponsored airfare-hotel accomodation-honorium)

SLIDES Big data Big Analytics

2) Data Analytics using the Cloud- Challenges and Opportunities for India at 1st International Symposium on Big Data and Cloud Computing Challenges(ISBCC-2014) March 27-28, 2014 VIT University, Chennai, India Sponsored by BRNS (flight)

http://chennai.vit.ac.in/isbcc/

SLIDES Data analytics using the cloud challenges and opportunities for india from Ajay Ohri

3) Open Source Analytics at OSSCamp 2014 http://osscamp.in/

http://osscamp.in/events/6/open-source-analytics-overview-r-python-and-others

SLIDES- Open source analytics from Ajay Ohri

4) Society for Industrial and Applied Mathematics- Delhi Technological University Evolute 2015 : Annual Symposium Speaker

5) Talk on Analytics as a profession at Indian Institute of Technology Delhi

Learning R and Teaching R from Ajay Ohri

Workshops

Pre-Placement training workshop for Economics Students, Delhi School of Economics.

A Workshop on R from Ajay Ohri

Books

R for Business Analytics http://www.springer.com/us/book/9781461443421

R for Cloud Computing : A Data Science Approach http://www.springer.com/us/book/9781493917013

Revolution Analytics ( Microsoft) Corporate Blog

http://blog.revolutionanalytics.com/2011/08/9-more-ways-to-bring-data-into-r.html

http://blog.revolutionanalytics.com/2012/11/using-r-in-the-human-resources-department.html


Journal Articles

Journal of Statistical Software

https://www.jstatsoft.org/article/view/v066b04

Technometrics

Technometrics, Vol. 55 (3), August, 2013

http://amstat.tandfonline.com/doi/abs/10.1080/00401706.2013.822219


Major Media

been cited by Wired Magazine and ReadWriteWeb for espousing a marketplace for algorithms.

http://www.wired.com/2014/08/algorithmia/

http://readwrite.com/2011/06/01/an-app-store-for-algorithms/


Interviews (of Ajay Ohri)

  1. Big Step Interview July 2015  Expert Interview with Ajay Ohri on the Importance of Big Data http://blog.bigstep.com/big-data-experts-interviews/expert-interview-with-ajay-ohri-on-the-importance-of-big-data/
  2. AnalyticsVidhya Feb 2015 Interview with Industry expert – Ajay Ohri, Founder, decisionstats.com http://www.analyticsvidhya.com/blog/2015/02/interview-expert-ajay-ohri-founder-decisionstats-com/
  3. AnalyticsIndia Magazine Nov 2012 Interview – Ajay Ohri, Author “R for Business Analytics” http://analyticsindiamag.com/interview-ajay-ohri-author-r-for-business-analytics/
  4. HRTechEurope More R in HR Nov 2012 http://blog.hrtecheurope.com/more-r-in-hr/
  5. Data Mining Research Jan 2011 Interview Data Mining Research interview: Ajay Ohrihttp://www.dataminingblog.com/data-mining-research-interview-ajay-ohri/

AnalyticBridge Apr 2008 Interview with Ajay Ohri, Data Mining Consultant from India http://www.analyticbridge.com/group/interviews/forum/topics/2004291:Topic:11703

Data Science Apps for Plug and Play Data Science

I was reading the 12 factor App and was struck by how much data science practitioners could use these principles too, for example when making a Shiny Dashboard App

Also I hope we can have more plug and play data science for mobile data or data generated by mobile apps (which is increasing)

Screenshot from 2016-05-11 23:11:17

An example is this app here https://gallery.shinyapps.io/CampaignPlanner_v3/ which can possible modified to add integration with Google Web Analytics API (etc).

This approach can make R more enterprise ready for production environments where it currently lags behind Python in terms of both appeal as well as trained people.

http://12factor.net/

The Twelve Factors

I. Codebase

One codebase tracked in revision control, many deploys

II. Dependencies

Explicitly declare and isolate dependencies

III. Config

Store config in the environment

IV. Backing services

Treat backing services as attached resources

V. Build, release, run

Strictly separate build and run stages

VI. Processes

Execute the app as one or more stateless processes

VII. Port binding

Export services via port binding

VIII. Concurrency

Scale out via the process model

IX. Disposability

Maximize robustness with fast startup and graceful shutdown

X. Dev/prod parity

Keep development, staging, and production as similar as possible

XI. Logs

Treat logs as event streams

XII. Admin processes

Run admin/management tasks as one-off processes

Early Bird Prices for PAW Chicago

Early bird prices for passes to Predictive Analytics World for Business in Chicago – June 20-23 – end Friday, May 6th. Be sure to register for your pass at the best rate available before the early bird deadline flies away.

Predictive Analytics World for Chicago 

Early Bird Prices:

All Access Pass: $3,450
Two-Day Pass: $1,700
All Access Combo Pass: $3,740
Two-Day Combo Pass: $1,990

Regular Prices:

All Access Pass: $3,850
Two-Day Pass: $2,100
All Access Combo Pass: $4,040
Two-Day Combo Pass: $2,290

Check out this video overview of PAW Business:

When you register by Friday, May 6th, enjoy early bird rates that keep $300-400 in your pocket.

Register Today!— end of message

Some terms for budding data scientists

Quandl just came up with a list of seven deadly sins for Data Scientists.  Their site provides a wide collection of data that would be beneficial for anyone looking to become successful in the analytical field. I interviewed their founder some time back here

I would add lack of reading as the biggest sin, and lack of writing /blogging as a big sin too. I guess that would be covered in Sloth.

Quandl_7_sins_872kb

Some terms that a data scientist should not be slothful about learning

Overfitting-

Overfitting occurs when a statistical model describes random error or noise instead of the underlying relationship. Overfitting generally occurs when a model is excessively complex, such as having too many parameters relative to the number of observations

What it leads to- Model explains your existing data fine but wont work on fresh data


Lift

lift is a measure of the performance of a targeting model (association rule) at predicting or classifying cases as having an enhanced response (with respect to the population as a whole), measured against a random choice targeting model. A targeting model is doing a good job if the response within the target is much better than the average for the population as a whole. Lift is simply the ratio of these values: target response divided by average response.

For example, suppose a population has an average response rate of 5%, but a certain model (or rule) has identified a segment with a response rate of 20%. Then that segment would have a lift of 4.0 (20%/5%).

Typically, the modeller seeks to divide the population into quantiles, and rank the quantiles by lift.

Hosmer-Lemeshow Goodness-of-Fit Test

The Hosmer–Lemeshow test is a statistical test for goodness of fit for logistic regression models. It is used frequently in risk prediction models. The test assesses whether or not the observed event rates match expected event rates in subgroups of the model population. The Hosmer–Lemeshow test specifically identifies subgroups as the deciles of fitted risk values. Models for which expected and observed event rates in subgroups are similar are called well calibrated.

First, the observations are sorted in increasing order of their estimated event probability. The event is the response level specified in the response variable option EVENT=, or the response level that is not specified in the REF= option, or, if neither of these options was specified, then the event is the response level identified in the “Response Profiles” table as “Ordered Value 1”. The observations are then divided into approximately 10 groups according to the following scheme.


Bayes Theorem

Bayes’ theorem is stated mathematically as the following equation:[2]

P(A|B) = \frac{P(B | A) \, P(A)}{P(B)},

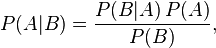
where A and B are events.

  • P(A) and P(B) are the probabilities of A and B without regard to each other.
  • P(A | B), a conditional probability, is the probability of observing event A given that B is true.
  • P(B | A) is the probability of observing event B given that A is true.

Examples

Cancer at age 65

Suppose we want to know an individual’s probability of having cancer, but we know nothing about them. Despite not knowing anything about that person, a probability can be assigned based on the general prevalence of cancer. For the sake of this example, suppose it is 1%. This is known as the base rate or prior probability of having cancer. “Prior” refers to the time before being informed about the particular case at hand.

Next, suppose we find out that person is 65 years old. If we assume that cancer and age are related, this new piece of information can be used to better assess that person’s risk of having cancer. More precisely, we’d like to know the probability that a person has cancer when it is known that they are 65 years old. This quantity is known as the current probability, where “current” refers to the theorised situation upon finding out information about the particular case at hand.

In order to apply knowledge of that person’s age in conjunction with Bayes’ Theorem, two additional pieces of information are needed. Note, however, that the additional information is not specific to that person. The needed information is as follows:

  1. The probability of being 65 years old. Suppose it is 0.2%
  2. The probability that a person with cancer is 65 years old. Suppose it is 0.5%. Note that this is greater than the previous value. This reflects that people with cancer are disproportionately 65 years old.

Knowing this, along with the base rate, we can calculate that a person who is age 65 has a probability of having cancer equal to

(0.5% * 1%) \div 0.2% = 2.5%

Gradient Descent for Machine Learning

tochastic gradient descent (often shortened in SGD) is a stochastic approximation of the gradient descent optimizationmethod for minimizing an objective function

Both statistical estimation and machine learning consider the problem of minimizing an objective function that has the form of a sum:

Q(w) = \sum_{i=1}^n Q_i(w),

where the parameter w which minimizes Q(w) is to be estimated. Each summand function Q_i is typically associated with the i-th observation in the data set (used for training).

In classical statistics, sum-minimization problems arise in least squares and in maximum-likelihood estimation (for independent observations).

https://www.coursera.org/learn/machine-learning/lecture/kCvQc/gradient-descent-for-linear-regression

Screenshot from 2016-04-25 11:39:21

Source

https://en.wikipedia.org/wiki/Lift_(data_mining)

http://www.newyorker.com/culture/culture-desk/remembering-prince

https://en.wikipedia.org/wiki/Bayes%27_theorem

https://en.wikipedia.org/wiki/Overfitting

https://support.sas.com/documentation/cdl/en/statug/63033/HTML/default/statug_logistic_sect039.htm

https://en.wikipedia.org/wiki/Hosmer%E2%80%93Lemeshow_test