
a talk I gave at IIT Delhi at Department of Management Studies to doctoral students is uploaded here
Author: Ajay Ohri
http://about.me/ajayohri
How to share your iPython (or iJulia code)
Basically
1) Download as Ipython file from the File Option

2) Use notepad to open the file downloaded. Copy the text contents

3) Create a new gist at by pasting the text from step 2 here
https://gist.github.com/ (assumes you have a github account)

4) Paste the url of the Gist into http://nbviewer.ipython.org/ to get your iNotebook url for sharing
5) To update your notebook, simply copy and paste the new IPython code by editing the gist again
6)
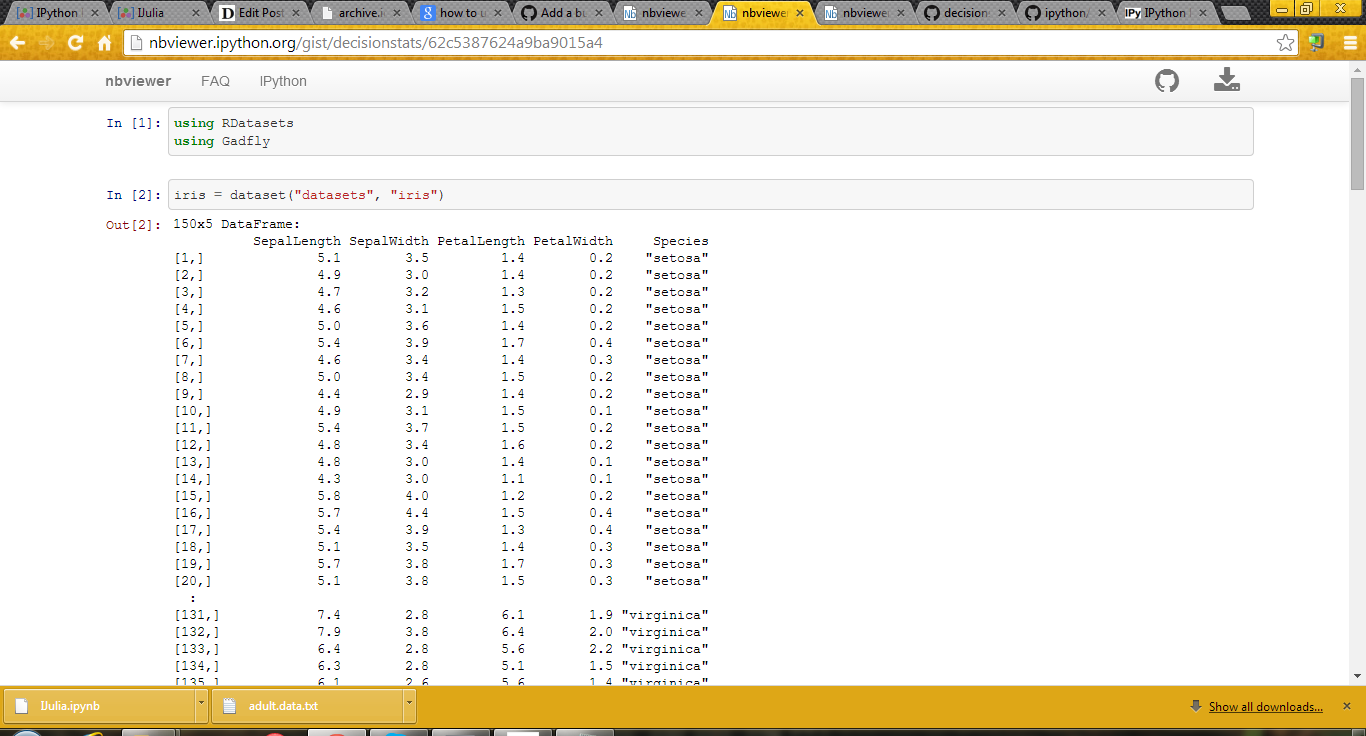
(example here- http://nbviewer.ipython.org/gist/decisionstats/62c5387624a9ba9015a4)
Beginner’s Notes in JULIA Language
- Packages
- Pkg.add(“RDatasets ”) installs package RDatasets
- using RDatasets –loads package RDatasets
- Pkg.update() Updates all packages
some packages to install IJulia, RDatasets, PyCall,PyPlot,Gadfly,Rif
- Data Input -pwd() – Gets you the current working directory
- cd(“C:/Path”) -Sets the working directory to the new path , here C:/Path
- readdir() – Lists all the files present in the current working directory
- using DataFrames
a=readtable(“1.csv”)
or df=readtable(“adult.data.txt”,header=false)
or
df= collect(readdlm(“adult.csv”))
or from package
Using RDatasets
iris=dataset(“datasets”,”iris”)
- Object Inspection
- summary(a) Gives the structure of object named including class, dimensions,
- colnames(a) Gives the names of variables of the object
- typeof(a) Gives the class of a object like data.frame, list,matrix, vector etc
size(a) Givesthe dimension of object (rows column)
Plots
using Gadfly
plot(df,x=”x1″ ,color=”x15″,Geom.histogram)
plot(iris,x=”SepalLength”,y=”SepalWidth”,color=”Species”)
using PyPlot
boxplot(df[:x15])
Note- we can use df[:x15] notation to refer to x15 variable in Data Frame df
For missing values we use Data Arrays and @data to convert object to Data Array
Then use removeNA ( or dropna in Julia 0.3) to remove missing values so as to run functions like mean etc
The describe function gives the numerical summary
describe(df[:x1])
NOTES-
1) Doesnt work very well on Win 32
2) Two interfaces – command line or IJulia Notebook
3) If you type an object name , gives you the first twenty and last twenty rows- which is quite intuitive designed.
4) PyCall is an interface to Python and Rif is an interface to R- but I had issues trying to work with Rif
5) Basically even simple things( functions!) are renamed in Julia- the effort seems to keep it distinct with R
6) PyPlot for basic plots and Gadfly for ggplot2 plots
Note- some of it was shown here-Updated
http://nbviewer.ipython.org/gist/decisionstats/62c5387624a9ba9015a4
Use swirl to learn and teach R very very easily and interactively #rstats
I really love this new package for making R easy to learn ( and ergo to teach) . See swirl
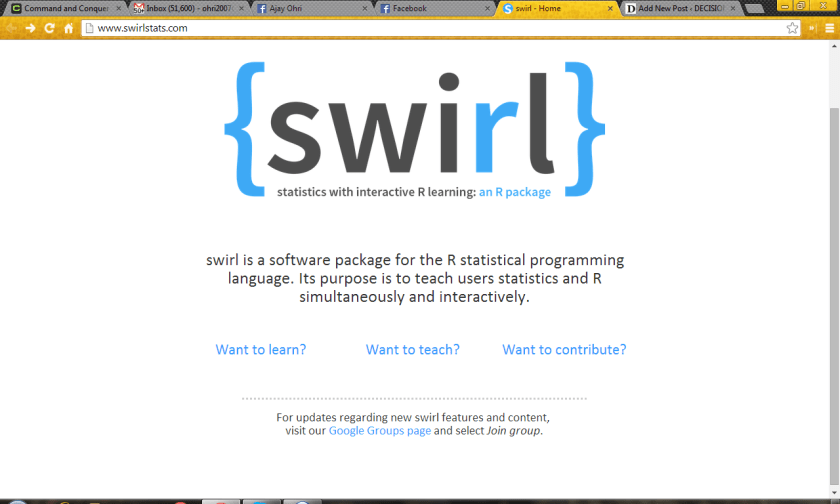
a clever and painstaking way to teach R – this one deserves kudos to the package creators
| Author: | Nick Carchedi [aut, cre],
Bill Bauer [aut], Gina Grdina [aut], Sean Kross [aut] |
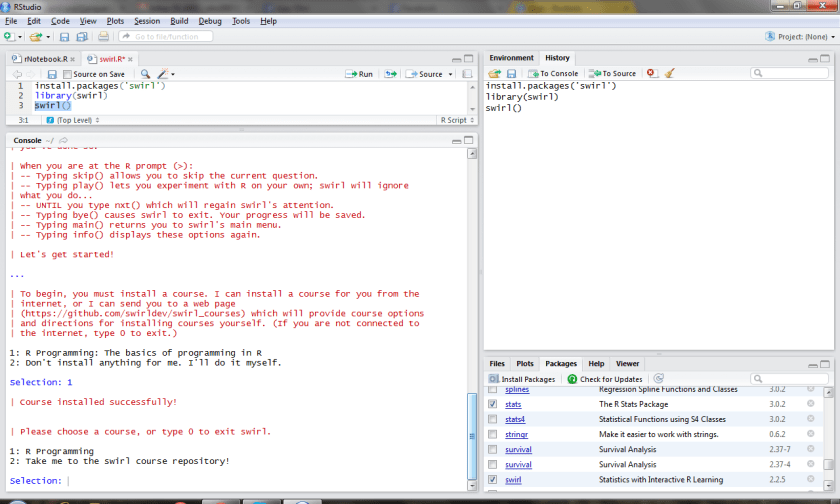
A typical swirl session has a user load the package from the R console, choose from a menu of options the course he or she would like to take, then work through 10-15 minute interactive modules, each covering a particular topic.
A module generally alternates between instructional text output to the user and prompts for the user to answer questions.
One question may ask for the result of a simple numerical calculation, while another requires the user to enter an actual R command (which is parsed and executed, if correct) to perform a requested task.
Multiple choice, text-based and approximate numerical answers are also fair game.
Whenever the user answers a question incorrectly, immediate feedback is given in the form of a hint before prompting her to try again.
Finally, plots, figures, and even videos may be incorporated into a module for the sake of reinforcing the methods or concepts being taught.
—
Note I really hope people who have been passionate about creating the wonderful tutorials and slides for R take a second or two to demo the CRAN package “swirl”
http://cran.r-project.org/web/packages/swirl/index.html
Hopefully we can see Big Data or even R Hadoop Tutorials on swirl soon
From
https://github.com/swirldev/swirl_courses#swirl-courses
The following are some of our more popular courses:
- R Programming
- Regression Models (in progress)
- Data Analysis
- Mathematical Biostatistics Boot Camp
- Open Intro
———————————————————————————————
India and R #rstats
While India is downloading a lot of R packages, it seems only one Indian (?) has ever gone to a UseR annual conference- the latest being in LA http://user2014.stat.ucla.edu/#registration despite India having a huge hub of analytics talent. (and even impressive number of official SAS certifications)
But seriously just one attendee. With so many downloads and so many R Blogger visits?
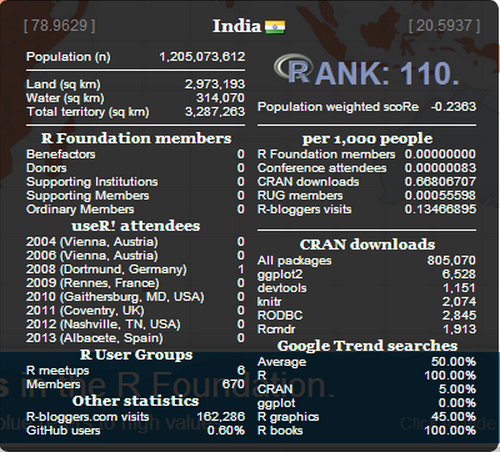
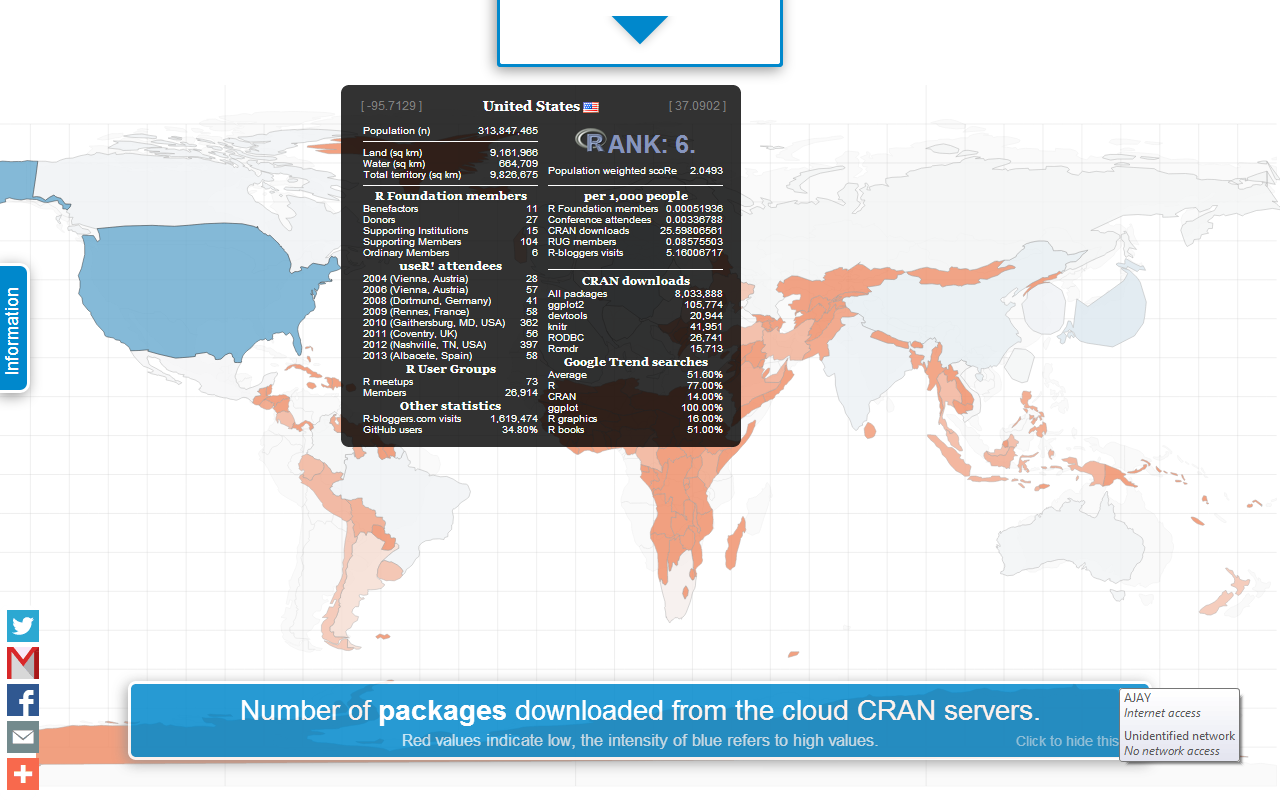
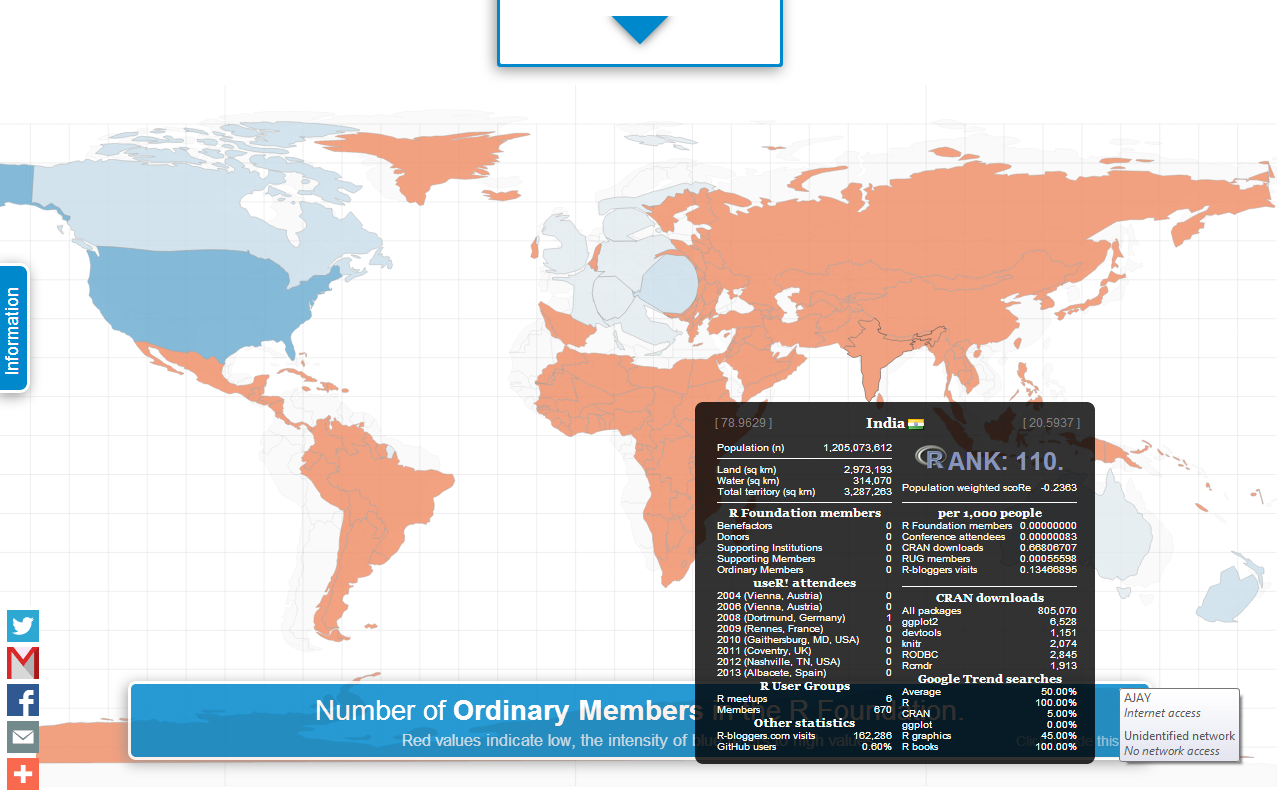
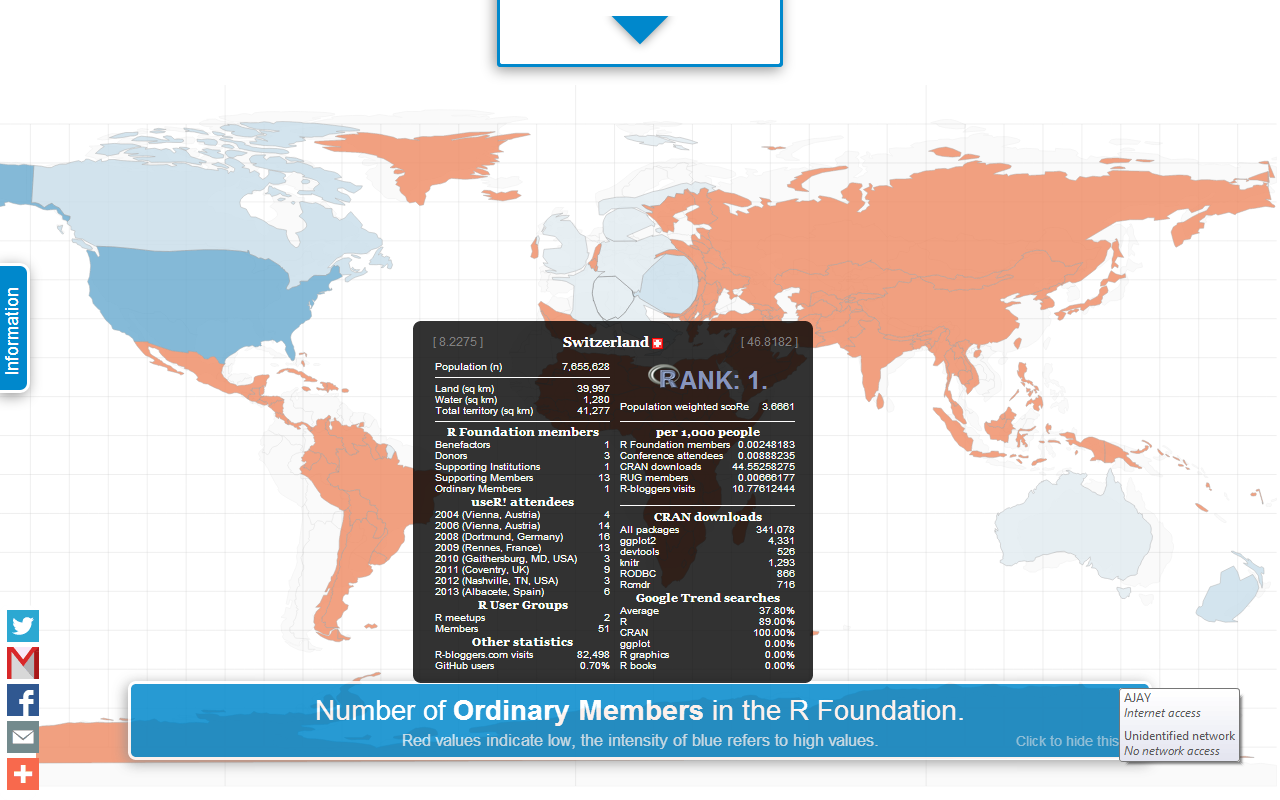
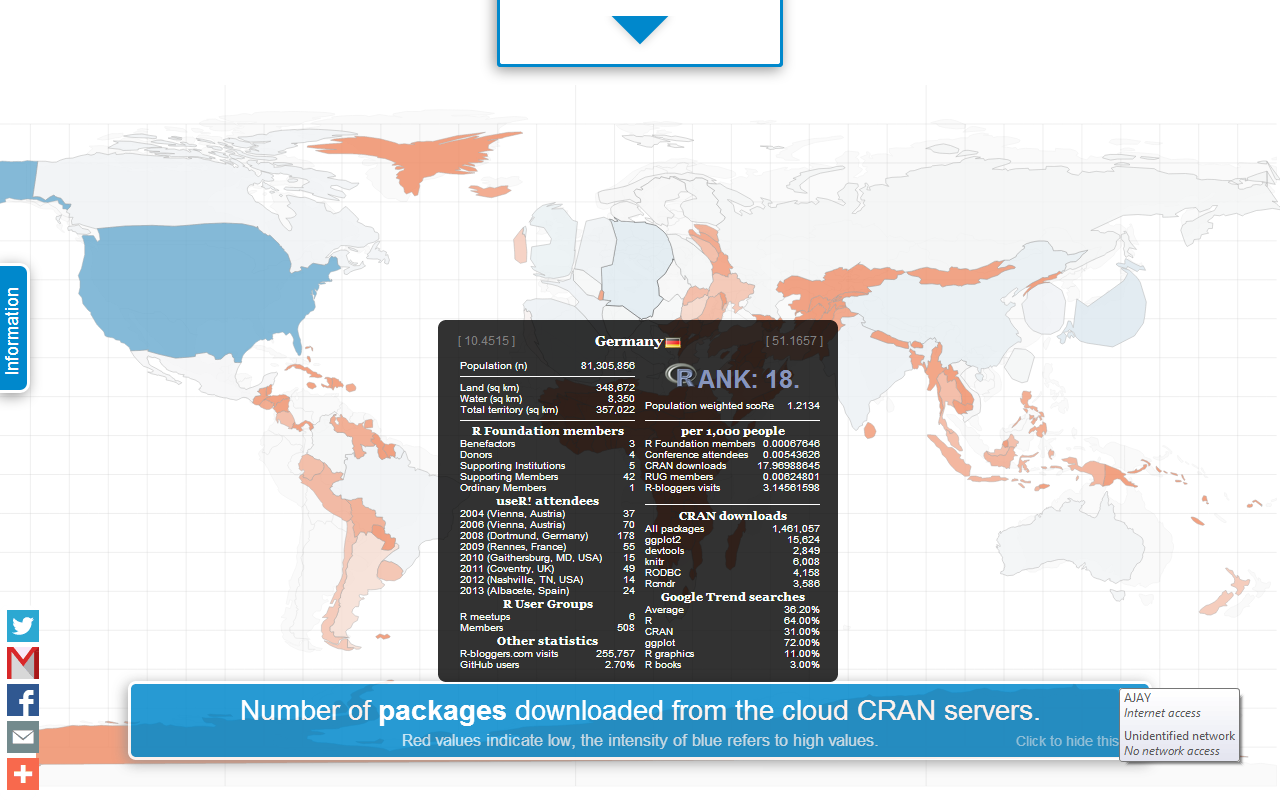
The lovely cartograms from the brilliant Rapporter team here
You need to hover to get the data by country
You can see the app here and http://rapporter.net/custom/R-activity/#CRAN_all/6
Clearly this is not true as many people of Indian origin do contribute to the R program, however the country wide demographics suggest that the R project is clearly a Western (and not a truly global endeavour) . Maybe the R foundation can try moving the conference a bit more Eastern (hemisphere wise)- or maybe the digital divide is just a practical way of the world order.
Unless China creates a fork of R 😉
Introduction to HR Analytics
a rather humble and hasty though honest approach at HR Analytics
Talking on Analytics
I will be talking to doctoral and MBA students at IIT Delhi on May 10. The talk is Data Analytics and Cloud Computing and will be there for 2 hours, but will be much more broad ranging than that including touching on HR Analytics and Data Science. If you are local to Delhi around this date- you can contact me in case you want to attend in person.
———————————————————-
AN INTRODUCTION TO BIG DATA ANALYTICS AND CLOUD COMPUTING
In this talk we will discuss big data analytics including Hadoop and R, and the emergence of Cloud Computing. The focus will be on introducing fast changing technologies and what it means for enterprises and researchers. We will also cover data science as potential career paths.
About-
Ajay Ohri is the founder of Decisionstats.com and author of R for Business Analytics. You can connect with him on http://linkedIn.com/in/ajayohri
Earlier Talks –
https://decisionstats.com/2014/04/20/talking-on-analytics-rstats-analytics-bigdata-sas-conferences/
