Here is an interview with Naveen Gattu, COO and co-founder of Gramener ,one of the most happening data science companies.

Ajay- Describe the story so far for Gramener. What have been the key turning points ?
Naveen- All founders of Gramener are first generation entrepreneurs, started our careers with IBM were very successful in our corporate jobs with hefty pay packages, but always at the back of the mind can’t we work our ourselves and have FUN.
With this thought in mind 6 of us got together in 2010 to lay foundation for Gramener, with our consulting experience we wanted to get into business analytics , but soon we realized that there are lot many people who are doing great analytics but not an effective way of presentation, we wanted to establish niche for ourselves and create an offering to make “Data Consumption” easy and joyful.
Our significant milestone was Airtel accepting our offering and engaging us, this was a great launch pad for commercializing the product and instilled greater confidence amongst us. We being adjudged as Lufthansa Pioneering spirit and Nasscom Emerge 50 for 2012 were few other turning points from branding standpoint. It’s an entrepreneur dream to feature on front page of Economic times, we were able to accomplish this on Jan 22 which is a significant milestone.
We are expanding globally having carved and proved in India,this will be our next significant milestone.
Ajay- How would you describe your products and services compared to other data visualization like Tableau Software.
Naveen- Meaningful consumption of data – (discovery, understanding, correlation and coherent business actions) in enterprises has still not risen to a point where all parts of business act cohesively, based on what the data reveals. Diverse understanding of the same data by various functions, BI projects which are still IT led, lack of skills in the end user community to seek out relevant data at the speed at which business demands have all let enterprises to be sub-optimal in usage and application of data.
The single factor which is most pronounced in this phenomenon is lack of simple tools to represent data in a manner all stakeholders understand coherently and consistently. Gramener creates visualizations which are simple, powerful, appropriate and relevant to not only to data sets and but also are meaningful to functions and businesses.
The very fact that human cognizance is enabled through simple visualizations helps to have all stakeholders arrive at mental models that are similar and eliminates the complexity in consuming data that is most relevant to them. This aids in acting fast and in unison led by the common understanding of the data by all.
We differ from tools like Tableau, Spotfire, Qlikview as these are data exploratory kind of tools, whereas we align very closely to the business user and position ourselves as “User experience BI”
Ajay- What are a few examples where you created lots of customer insights by unlocking actionable analysis by data visualization?
Naveen- Examples of a visualization insight that generated a huge positive impact for our client,
This is an anonymised version of our very first visualization.
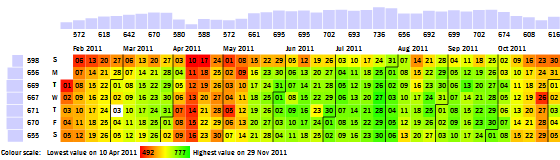
We were working with a leading mobile operator who provided us with minutes-of-usage data. We plotted this time-series on a calendar, creating the Calendar Map you see above. Red cells show days with lower usage, and green cells show days with higher usage.
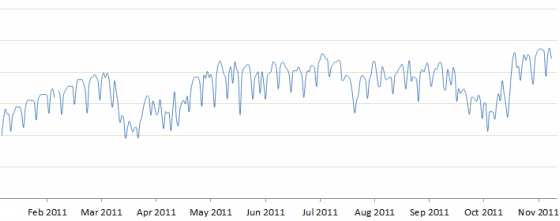
This made it possible to spot a number of patterns that were relatively hidden until then. For example, on this calendar map, it’s obvious that call volumes are lower on Sundays. But 31st July was a relatively good Sunday, with high call volumes. That’s tough to spot on a line graph because it’s not high in absolute terms — just high for a Sunday.
With this visualization, our client discovered a number of insights in calling pattern behavior of their customer segments. For example, the share of rural traffic rises on Sundays, mainly because urban traffic falls while rural traffic is unaffected. It also made it possible for them to identify specific days on which their competitors’ call volumes shot up, and helped them identify which competitor’s campaigns were proving effective against them.
The visualization is now integrated into their strategic review process.
Ajay- What are the various analytical and visualization tools you work with?
Naveen- We work only with our own product, which is a combination of analytical and visualization tool. Tool also has auto analysis which makes our analyst job automated to a greater extent.
Ajay- While your website is superb, your blog hardly fits the image of a cutting edge data visualization site at http://blog.gramener.com/ . What is your plan for social media marketing in 2013?
Naveen- Thanks for your comment on website and we take your feedback on our blog. We tend to leverage social media for our immediate branding needs, reaching out to wider audience to keep them informed about our offerings, happenings and updates in the big data space. We also intend to leverage towards next few quarters for organized lead generation.
We have actively used Social media to solve our recruitment problem, here’s a visualization of the social network of geeks across different cities in India. An interactive version of this is available at http://gramener.com/codersearch. We built this to identify who would be a good candidate to hire, as well as decide which city is the best hunting ground for geeks.
Ajay- How good is the ecosystem in Bangalore for startups compared to other Indian cities and compared to other technology hubs ?
Naveen- Bangalore with our experience scores much better than any other city from access to technical talent, one of the key ingredient for startup success. Let me illustrate this with a simple visualization from our tool.
At Gramener, we took a look at the Github follower network in various cities in India. The images below show the social network of Github users at Bangalore and Chennai – the Indian cities with the most users on Github.
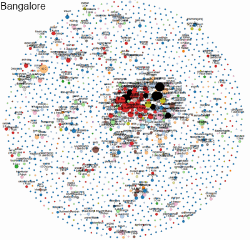
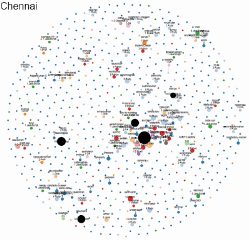
Firstly, Bangalore, with 1460 users, clearly has more coders than Chennai (658). But what’s also interesting is the relatively large networked cluster in Bangalore. This is something that’s lacking in most other cities, as you can see below.
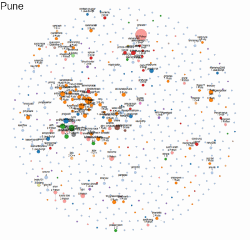
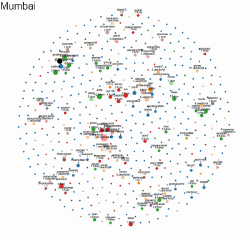
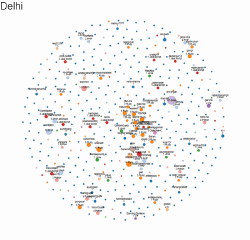
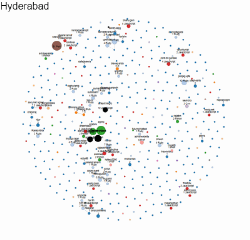 These cities tend to have smaller, disparate clusters. Whereas, in Bangalore, if you know some of the top Github users, you can easily hop from person to person and cover most of the popular users on Github. You can also guess that Hyderabad, Mumbai and Delhi (especially) are a bit less “sociable” and tend to form islands, when compared to Chennai or Pune.
In a way, this is reflected in the city’s social interaction as well. It’s a whole lot easier to meet a group of developers in Bangalore than it is in almost any other city in India.
To make your life easier, we’ve created a tool that lets you explore this social network.
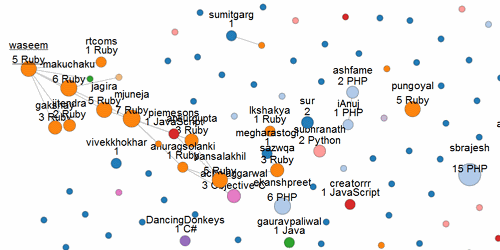
Each coder is shown as a circle. The size of the circle increases with the number of followers. The colour of the circle changes based on their primary programming language. The labels indicate their Github user ID, the number of followers and their main programming language. Lines indicate that a user is following another. You can move each circle around to get a better view, and click on the circle to open their Github page.
This graph is called a force-directed layout. They are an excellent way of exploring and visualising small-scale networks interactively, since it lets you compare the structure of different networks, and also drill deep into every node in a network.
Visit gramener.com/codersearch to see the tool in action.
About-
Naveen Gattu co-founded Gramener along with like-minded and seasoned professionals. Naveen handles business development and operations of the company. You can read more about him here http://in.linkedin.com/in/naveengattu
Gramener is a data visualization, predictive analytics and technology services company on the cutting edge of data science.You can see more on them here at http://gramener.com/company/