
28.635308
77.224960
Dining in San Francisco – Let R Guide You
I’m frequently asked by newcomers to R to provide an easy to follow generic set of instructions on how to download data, transform it, aggregate it, make graphs, and write it all up for publication in a high impact journal – all by the end of the day ! While such a request is somewhat understandable coming from a student it’s somewhat awkward when coming from a seasoned research investigator, (i.e. someone who should know better). Obviously, no such set of instructions exists given the astonishing variety of available data stored in differing formats with varying degrees of adherence to a standard(s). Simply put, “real world” data wrangling and analysis can be a complex process independent of the language you choose to employ. Nonetheless, what I’ll attempt to do here is provide a “tour” involving some data I picked at random. I’ll be sticking to the problems of downloading, filtering…
View original post 1,413 more words
Analyzing Facebook Networks using #rstats
Analyzing Facebook Networks using #rstats is given below. Note this can be replicated by anyone- and you can theoretically be able to create adjacency matrix (friend of friends) of all people who have given permission into your app- thus maybe a network analysis of people to some group (like R Facebook group https://www.facebook.com/groups/rusers/?fref=ts or even FOASStat https://www.facebook.com/groups/foastat/?fref=ts is possible
While traditional marketing and targeting focusses on variables like demographics and psychographics, social network analysis lets you tap into influential people within communities with the right offer and then let the free retweet, reshare as proxy free ads. The hypothesis being that people in similar network clusters have similar consumer behaviours (not just in similar demographic or psychographics). Also this should ideally be able to capture changing consumer behaviour faster for better targeting.
Sources-
1) Go to
2) Create a new app
https://developers.facebook.com/apps/241634542707615

3) Change url in settings ( to http://localhost:1410 ). I wish we could do this in twitteR package and oAuth for TWitter but I have no clue . that. Also coming up post on Google Plus and LinkedIn (if I can)
https://developers.facebook.com/apps/241634542707615/settings/

3) Copy the secret thingies from the dashboard. DO click the screenshots to enlarge (i.e to understand what I am trying to do here)
https://developers.facebook.com/apps/241634542707615/dashboard/
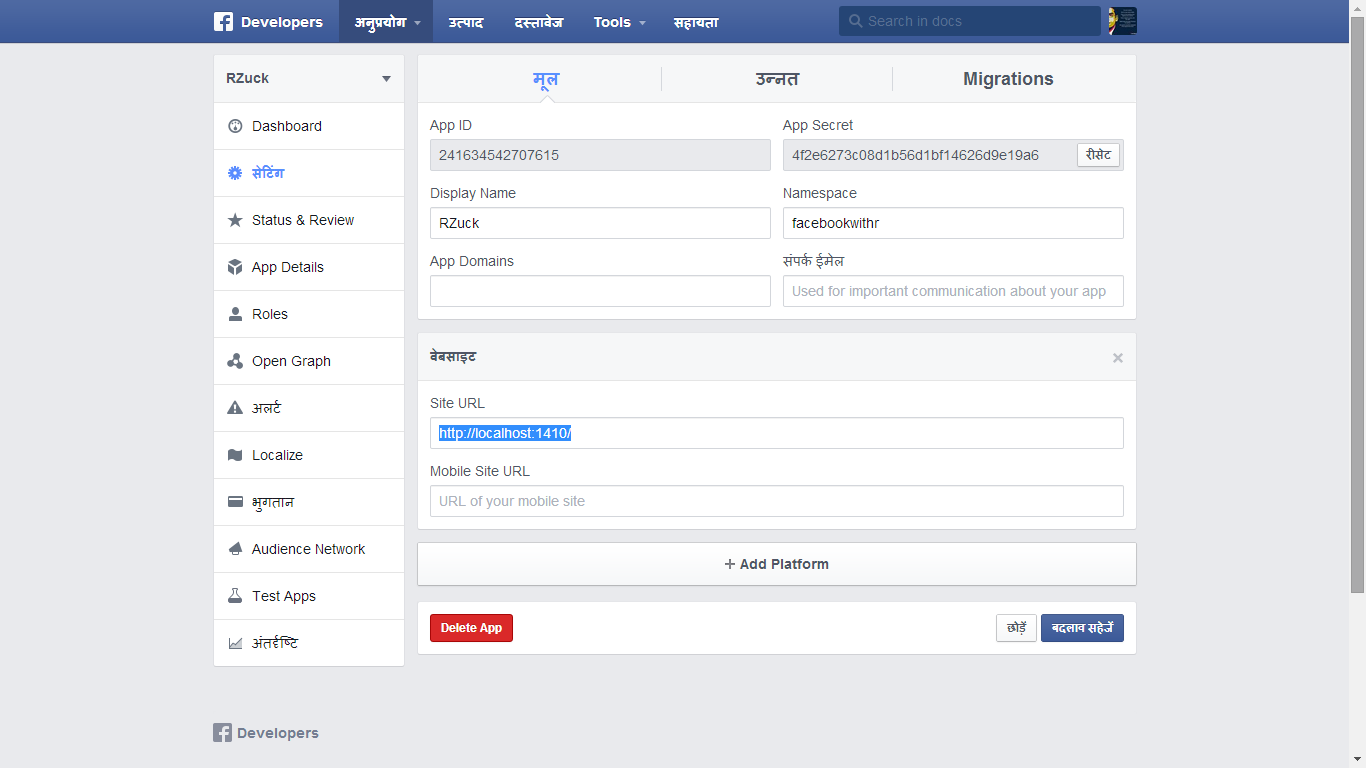
4) Modify code below with the secret thingies above
install.packages("Rfacebook")
install.packages("httpuv")
library(Rfacebook)
library(httpuv)
#fbOAuth(app_id, app_secret, extended_permissions = TRUE)
fb_oauth=fbOAuth("241634542707615", "4f2e6273c08d1b56d1bf14626d9e19a6", extended_permissions = TRUE)
#fb_oauth <- fbOAuth(app_id="123456789", app_secret="1A2B3C4D")
save(fb_oauth, file="fb_oauth")
getwd()
dir()
Created by Pretty R at inside-R.org
5) Hey now we have a fb ouath object we can just load it up. we the following code can then be modified at will to get your analysis
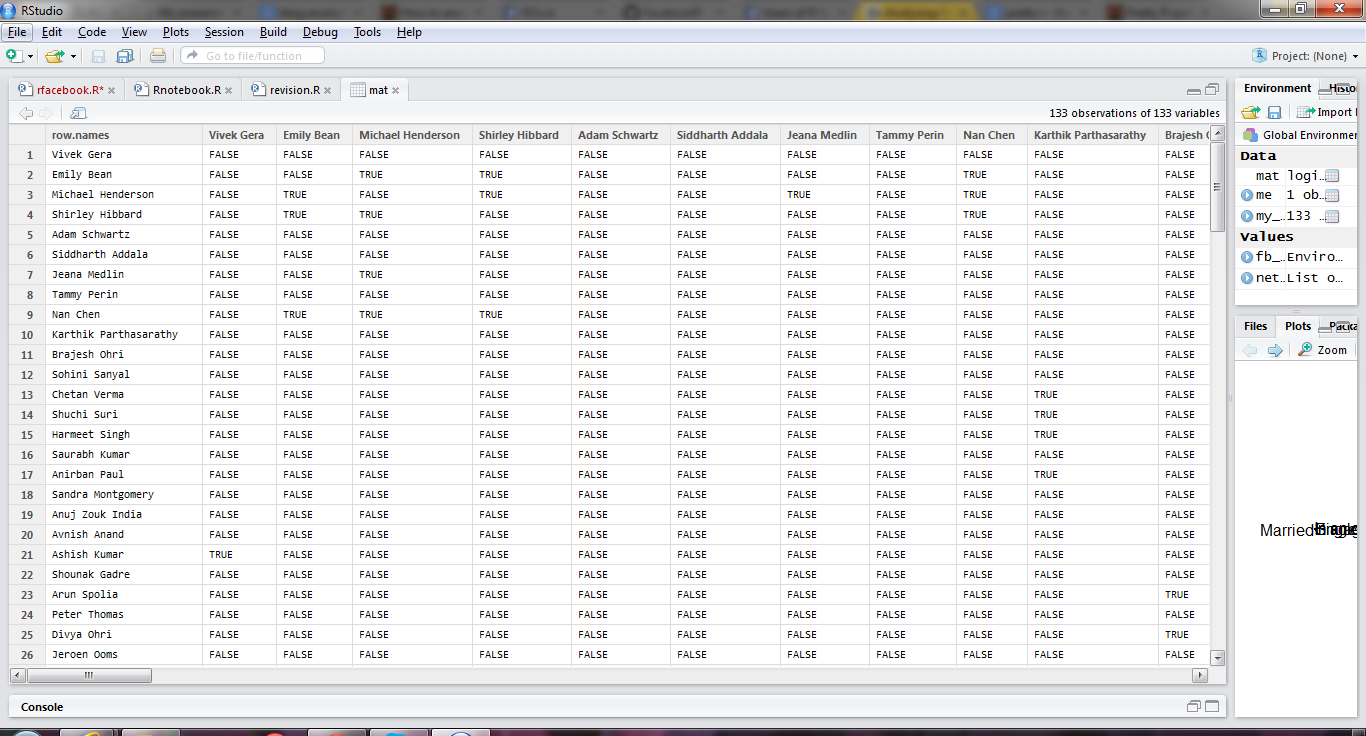
library(Rfacebook)
library(httpuv)
library(RColorBrewer)

load("fb_oauth")
me <- getUsers("me", token=fb_oauth)
#getFQL(query, token)
my_friends <- getFriends(token=fb_oauth, simplify=F)
str(my_friends)
table(my_friends$relationship_status)

pie(table(my_friends$relationship_status),col=brewer.pal(5, "Set1"))

table(my_friends$location)
pie(table(my_friends$location),col=brewer.pal(20, "Greens"))
pie(table(my_friends$locale),col=brewer.pal(4, "Blues"))
pie(table(my_friends$gender),col=brewer.pal(3, "Oranges"))

load("fb_oauth")

mat <- getNetwork(token=fb_oauth, format="adj.matrix")

library(igraph)

network <- graph.adjacency(mat, mode="undirected")
getwd()
setwd("C:/Users/dell/Desktop")

pdf("network_plot.pdf")

plot(network ,vertex.size=5,
     vertex.label=NA,
     vertex.label.cex=0.45,
     edge.arrow.size=1,
     edge.curved=TRUE,)

dev.off()
Created by Pretty R at inside-R.org
6) Voila my FB graph
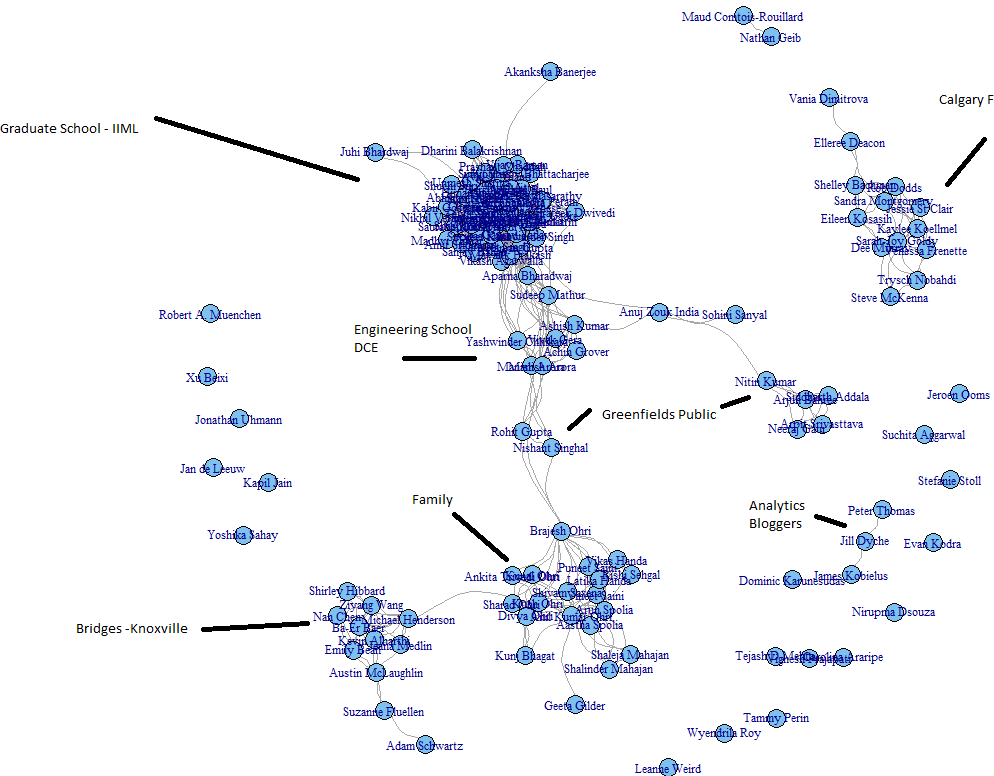
and analyzed for how are my homies
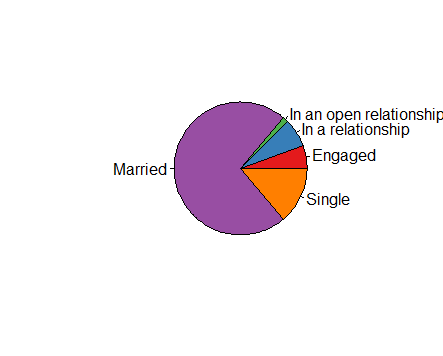
Europeans into open relationships more
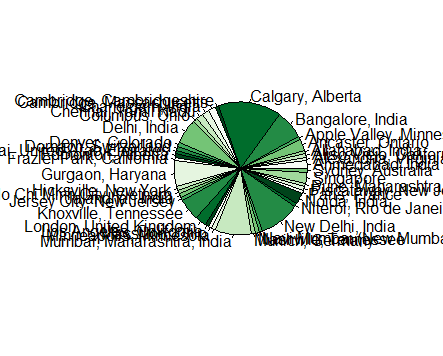
Places my friends are

Languages they speak
and all with R
Note- this is what an adjancency matrix is- just a fancy word for turning your Fb friends into a 1-0 matrix based on their relationships. The more friends you have the more interesting this analysis
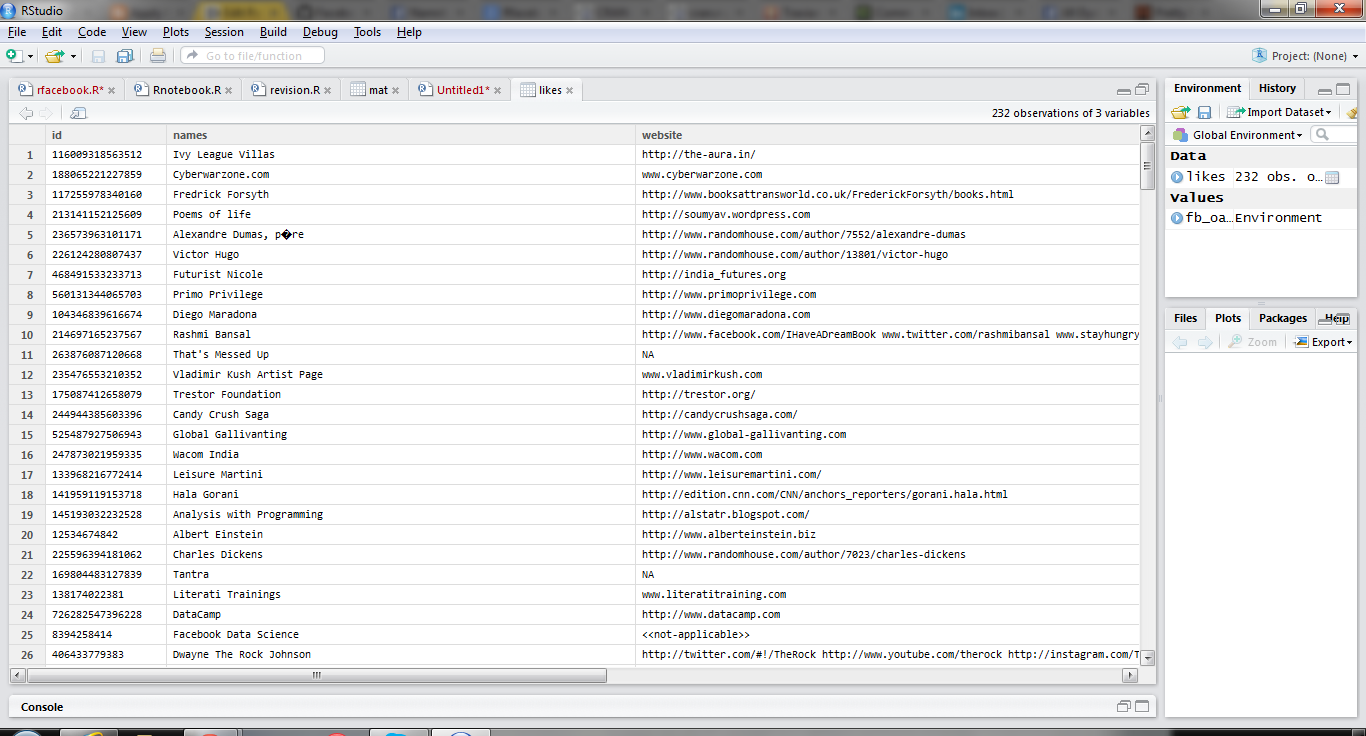
Now lets do likes analysis
I use this code and my own username (since I am the only one who has allowed the app permissions!)
likes=getLikes(user="byebyebyer",n=500,token=fb_oauth)
Boy I like a lot of websites huh- I wonder if I can cluster/ data reduce/association analysis them (but that’s coming up or is it?)
Hat tips-
http://blog.revolutionanalytics.com/2013/11/how-to-analyze-you-facebook-friends-network-with-r.html
Decision Making in the era of Big Data, Cloud Computing, Data Science and R
a talk I gave at IIT Delhi at Department of Management Studies to doctoral students is uploaded here
How to share your iPython (or iJulia code)
Basically
1) Download as Ipython file from the File Option

2) Use notepad to open the file downloaded. Copy the text contents

3) Create a new gist at by pasting the text from step 2 here
https://gist.github.com/ (assumes you have a github account)

4) Paste the url of the Gist into http://nbviewer.ipython.org/ to get your iNotebook url for sharing
5) To update your notebook, simply copy and paste the new IPython code by editing the gist again
6)
(example here- http://nbviewer.ipython.org/gist/decisionstats/62c5387624a9ba9015a4)
Beginner’s Notes in JULIA Language
- Packages
- Pkg.add(“RDatasets ”) installs package RDatasets
- using RDatasets –loads package RDatasets
- Pkg.update() Updates all packages
some packages to install IJulia, RDatasets, PyCall,PyPlot,Gadfly,Rif
- Data Input -pwd() – Gets you the current working directory
- cd(“C:/Path”) -Sets the working directory to the new path , here C:/Path
- readdir() – Lists all the files present in the current working directory
- using DataFrames
a=readtable(“1.csv”)
or df=readtable(“adult.data.txt”,header=false)
or
df= collect(readdlm(“adult.csv”))
or from package
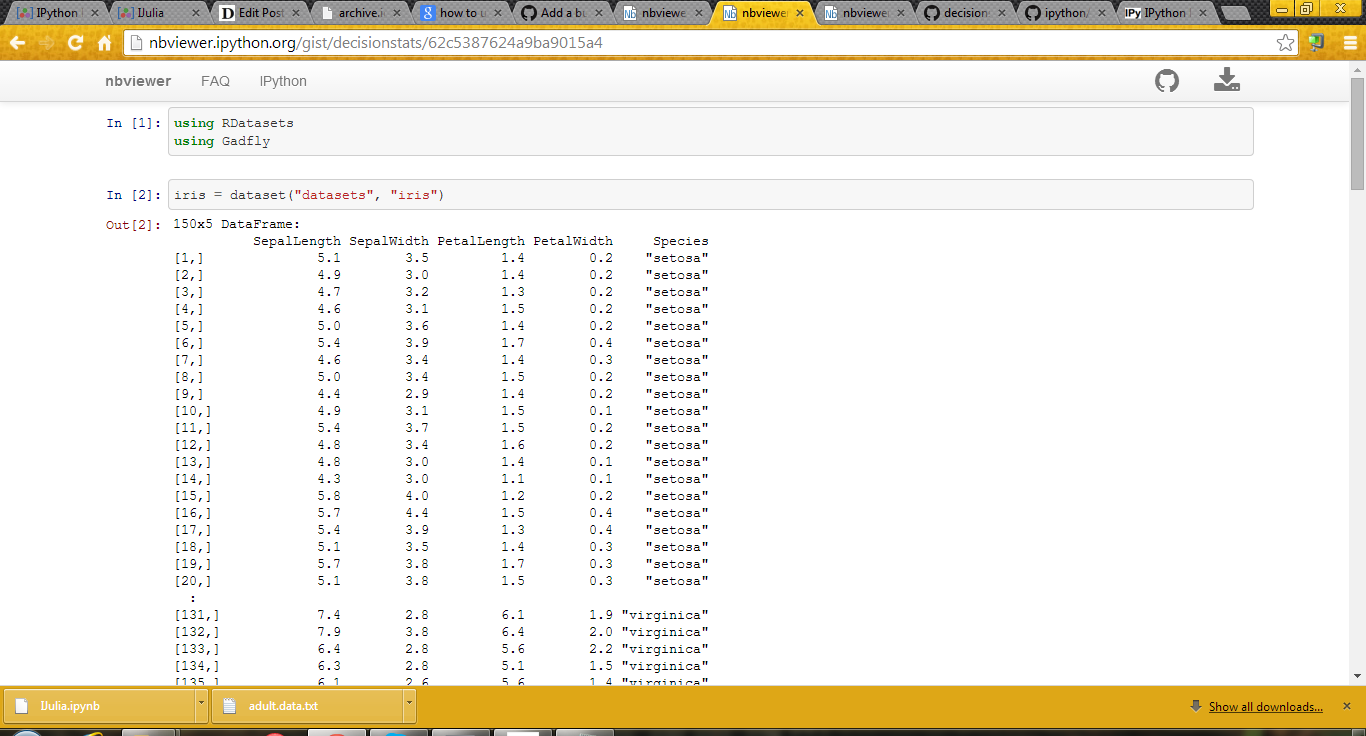
Using RDatasets
iris=dataset(“datasets”,”iris”)
- Object Inspection
- summary(a) Gives the structure of object named including class, dimensions,
- colnames(a) Gives the names of variables of the object
- typeof(a) Gives the class of a object like data.frame, list,matrix, vector etc
size(a) Givesthe dimension of object (rows column)
Plots
using Gadfly
plot(df,x=”x1″ ,color=”x15″,Geom.histogram)
plot(iris,x=”SepalLength”,y=”SepalWidth”,color=”Species”)
using PyPlot
boxplot(df[:x15])
Note- we can use df[:x15] notation to refer to x15 variable in Data Frame df
For missing values we use Data Arrays and @data to convert object to Data Array
Then use removeNA ( or dropna in Julia 0.3) to remove missing values so as to run functions like mean etc
The describe function gives the numerical summary
describe(df[:x1])
NOTES-
1) Doesnt work very well on Win 32
2) Two interfaces – command line or IJulia Notebook
3) If you type an object name , gives you the first twenty and last twenty rows- which is quite intuitive designed.
4) PyCall is an interface to Python and Rif is an interface to R- but I had issues trying to work with Rif
5) Basically even simple things( functions!) are renamed in Julia- the effort seems to keep it distinct with R
6) PyPlot for basic plots and Gadfly for ggplot2 plots
Note- some of it was shown here-Updated
http://nbviewer.ipython.org/gist/decisionstats/62c5387624a9ba9015a4
Use swirl to learn and teach R very very easily and interactively #rstats
I really love this new package for making R easy to learn ( and ergo to teach) . See swirl
a clever and painstaking way to teach R – this one deserves kudos to the package creators
| Author: | Nick Carchedi [aut, cre],
Bill Bauer [aut], Gina Grdina [aut], Sean Kross [aut] |
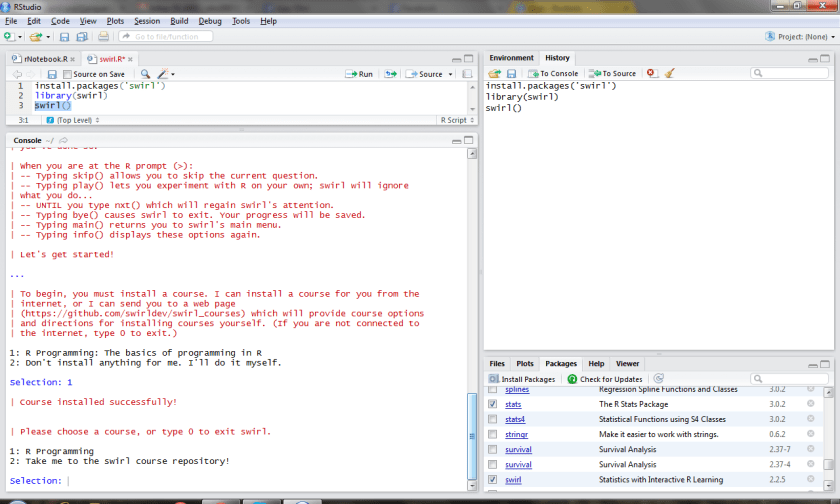
A typical swirl session has a user load the package from the R console, choose from a menu of options the course he or she would like to take, then work through 10-15 minute interactive modules, each covering a particular topic.
A module generally alternates between instructional text output to the user and prompts for the user to answer questions.
One question may ask for the result of a simple numerical calculation, while another requires the user to enter an actual R command (which is parsed and executed, if correct) to perform a requested task.
Multiple choice, text-based and approximate numerical answers are also fair game.
Whenever the user answers a question incorrectly, immediate feedback is given in the form of a hint before prompting her to try again.
Finally, plots, figures, and even videos may be incorporated into a module for the sake of reinforcing the methods or concepts being taught.
—
Note I really hope people who have been passionate about creating the wonderful tutorials and slides for R take a second or two to demo the CRAN package “swirl”
http://cran.r-project.org/web/packages/swirl/index.html
Hopefully we can see Big Data or even R Hadoop Tutorials on swirl soon
From
https://github.com/swirldev/swirl_courses#swirl-courses
The following are some of our more popular courses:
- R Programming
- Regression Models (in progress)
- Data Analysis
- Mathematical Biostatistics Boot Camp
- Open Intro
———————————————————————————————
