
from https://github.com/decisionstats/pythonfordatascience/blob/master/2%2BClustering%2B-K%2BMeans.ipynb


import matplotlib.pyplot as plt
from sklearn import datasets
from sklearn.cluster import KMeans
import sklearn.metrics as sm

import pandas as pd
import numpy as np
In [2]:
wine=pd.read_csv("http://archive.ics.uci.edu/ml/machine-learning-databases/wine/wine.data",header=None)
In [3]:
wine.head()
Out[3]:
In [4]:
wine.columns=['winetype','Alcohol','Malic acid','Ash','Alcalinity of ash','Magnesium','Total phenols','Flavanoids','Nonflavanoid phenols','Proanthocyanins','Color intensity','Hue','OD280/OD315 of diluted wines','Proline']
In [5]:
wine.head()
Out[5]:
In [6]:
wine.info()
In [7]:
wine.describe()
Out[7]:
In [8]:
pd.value_counts(wine['winetype'])
Out[8]:
In [9]:
x=wine.ix[:,1:14]
y=wine.ix[:,:1]
In [10]:
x.columns
Out[10]:
In [11]:
y.columns
Out[11]:
In [12]:
x.head()
Out[12]:
In [13]:
y.head()
Out[13]:
In [14]:
# K Means Cluster
model = KMeans(n_clusters=3)
model.fit(x)
Out[14]:
In [15]:
model.labels_
Out[15]:
In [16]:
pd.value_counts(model.labels_)
Out[16]:
In [17]:
pd.value_counts(y['winetype'])
Out[17]:
In [18]:
# We convert all the 1s to 0s and 0s to 1s.
predY = np.choose(model.labels_, [2, 1, 3]).astype(np.int64)
In [19]:
pd.value_counts(y['winetype'])
Out[19]:
In [20]:
pd.value_counts(model.labels_)
Out[20]:
In [21]:
pd.value_counts(predY)
Out[21]:
In [22]:
# Performance Metrics
sm.accuracy_score(y, predY)
Out[22]:
In [23]:
# Confusion Matrix
sm.confusion_matrix(y, predY)
Out[23]:
In [24]:
from ggplot import *
%matplotlib inline
In [25]:
p = ggplot(aes(x='Alcohol', y='Ash',color="winetype"), data=wine)
p + geom_point()

Out[25]:
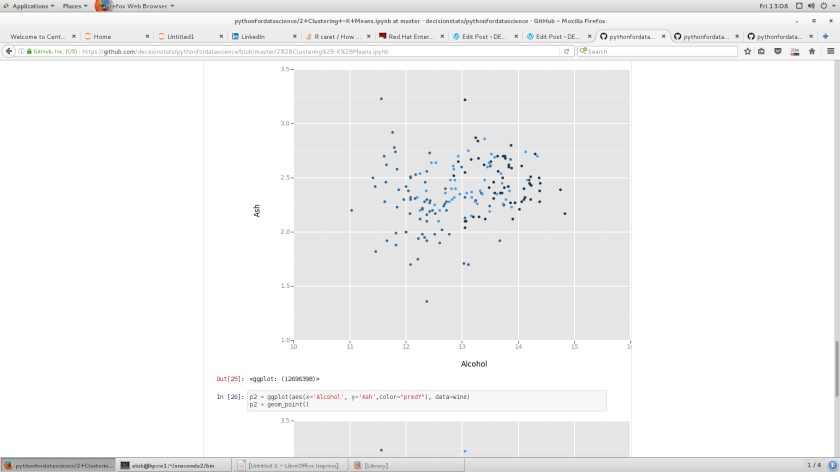
In [26]:
p2 = ggplot(aes(x='Alcohol', y='Ash',color="predY"), data=wine)
p2 + geom_point()
Out[26]:
