Gurus like this and this should me but I think something is rotten in the state of analytics data visualizations on the web.
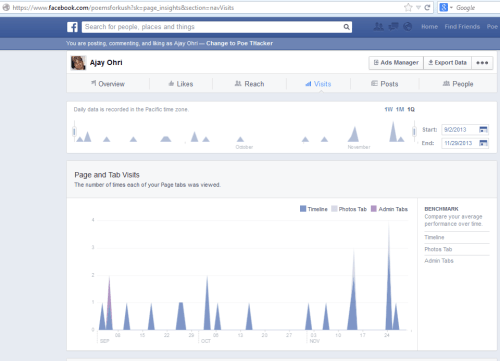
- Facebook Page Insights- Cool Viz- Blue Line Graphs
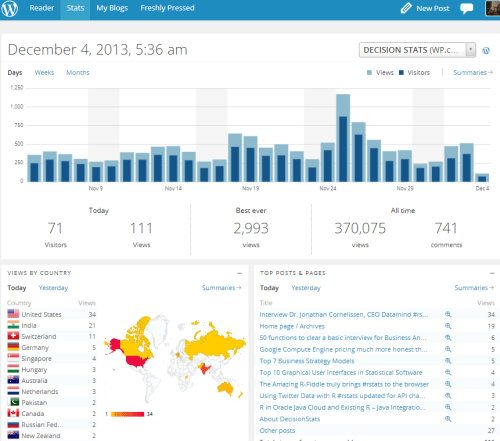
- WordPress prefers bar plots and spatial analysis (if only minimal)
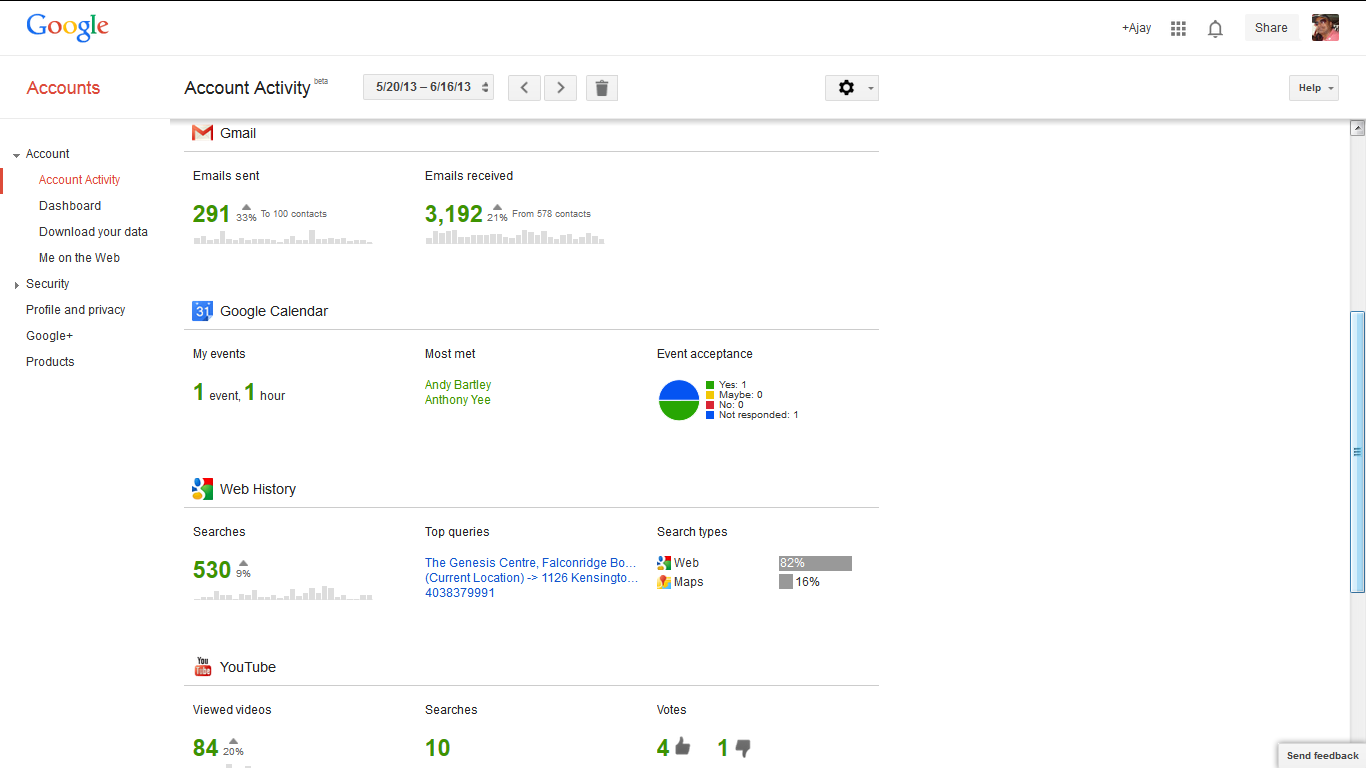
- Google Activity Dashboard prefers Tufte (?) . No it just shows fonts, and even a (gasp) pie chart.

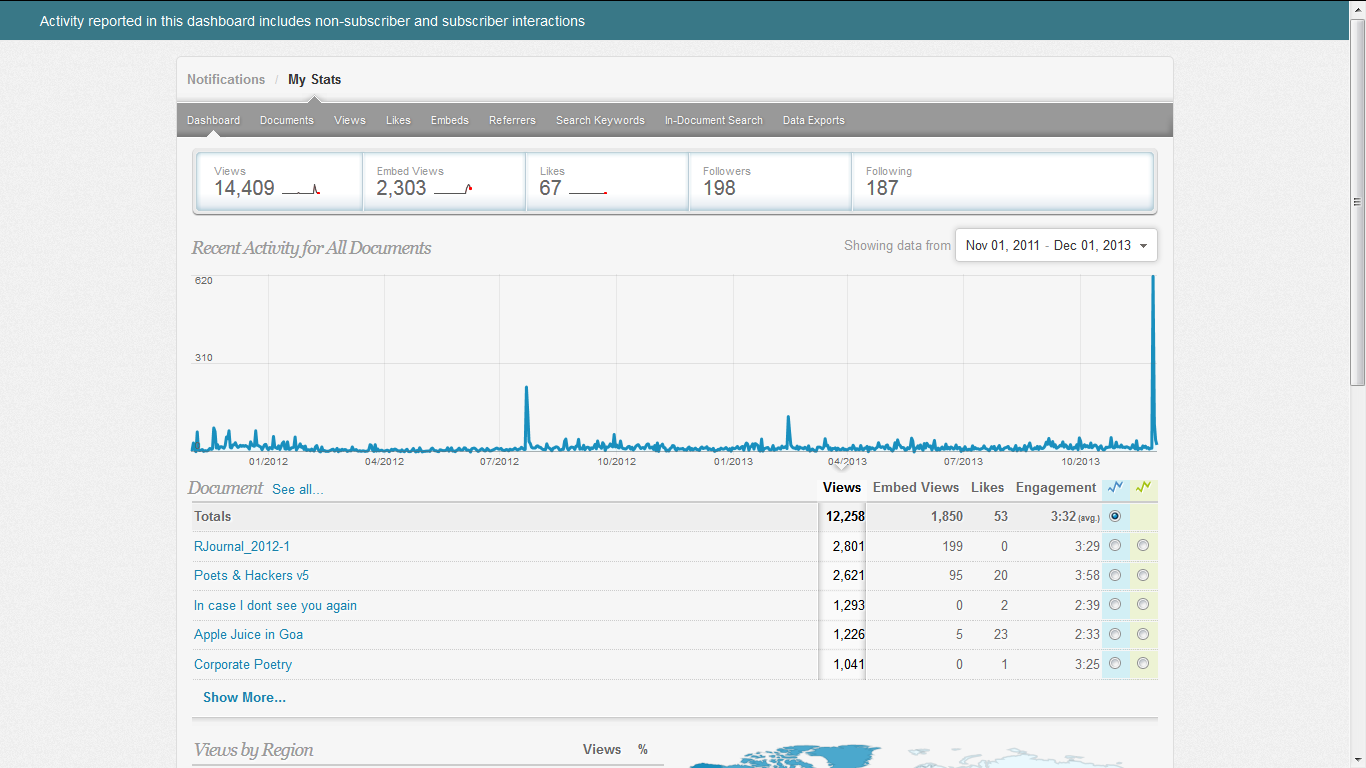
- Scribd prefers —yes tables and line graphs rule

- Slideshare Stats are a pro feature (!) . Free features are a table– sigh

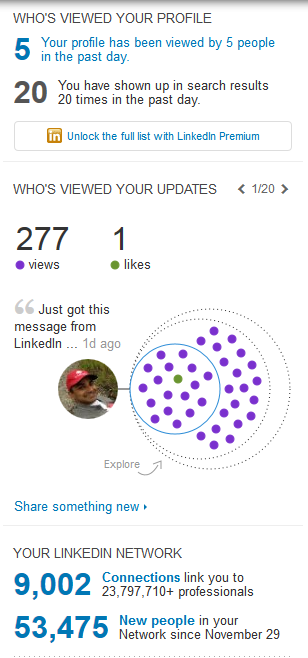
- LinkedIn – was a pioneer but now


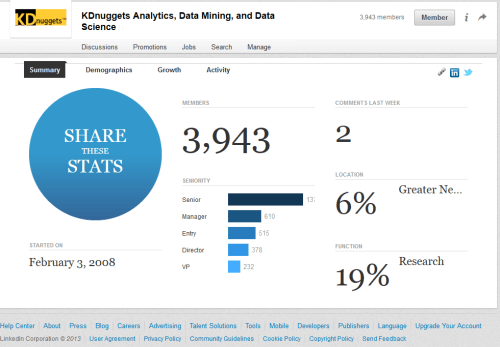
- Linkedin Groups viz
- Quora Stats – hmm

- My Anti Virus still likes doughnuts

- OFFICIAL Twitter Analytics


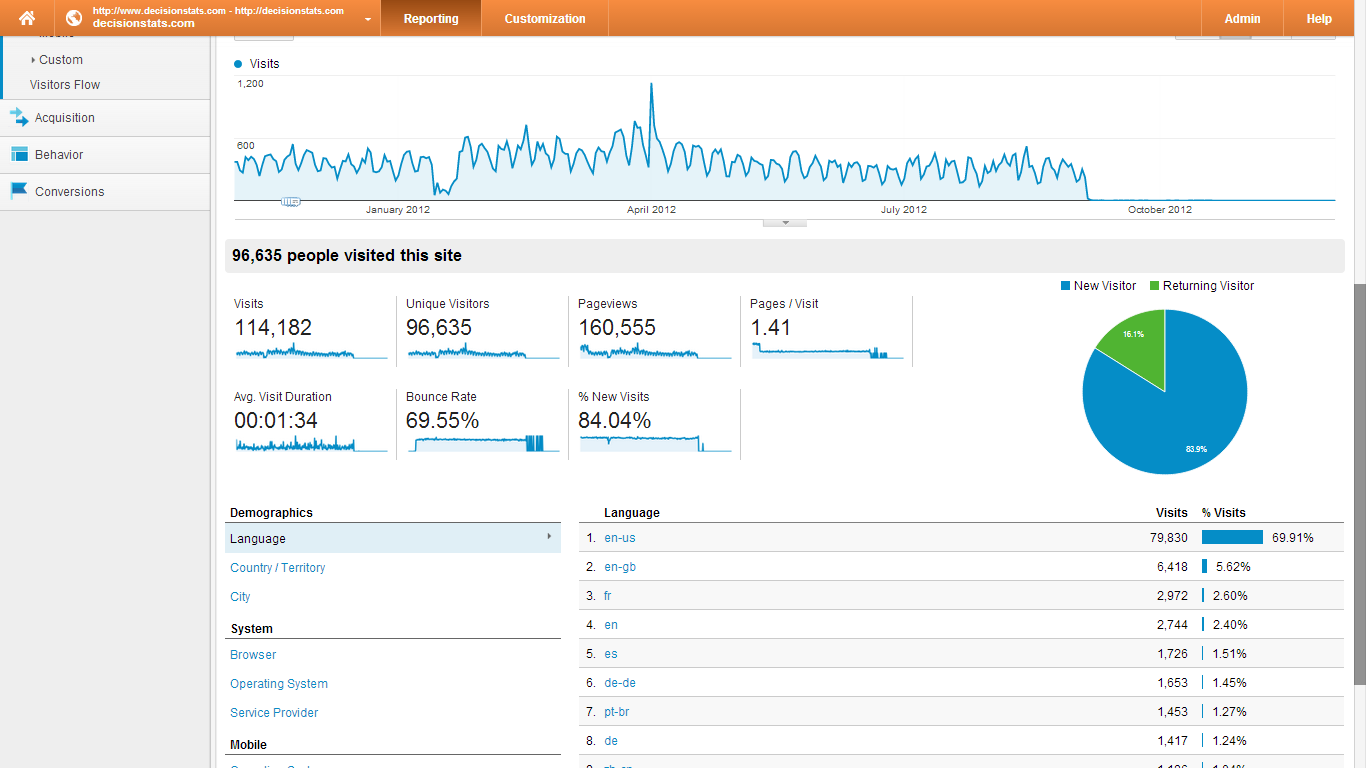
- Google Analytics – a synonym for data vizualization on the web has Napolean March Chart ambitions but fails to simplify beyond the simple and fails totally at the complex .
- That’s a pie chart, bitches!
- There is no data that can be displayed in a pie chart, that cannot be displayed BETTER in some other type of chart.” John Tukey