Talking on Cloud Computing

I am scheduled to deliver a talk here-http://chennai.vit.ac.in/isbcc/ . Will post slides once I am done!

1st International Symposium on Big Data and Cloud Computing Challenges(ISBCC-2014)

Mr. Ajay Ohri
Founder
decisionstats.com


Title:
Data Analytics using the Cloud – Challenges and Opportunities for India

Abstract:
The availability of the cloud offers unprecedented democratic access to high performance computing. How is India’s Information Technology powerhouse industry willing to exploit the shift in computing from the PC to the tablet/mobile/internet with the cloud replacing servers as thebackend. What are some of the challenges including privacy, legal, regulatory and national in cloud computing. How can we use open source analytics like R with public clouds to drive much more innovation in the Indian economy? The talk will address all this.

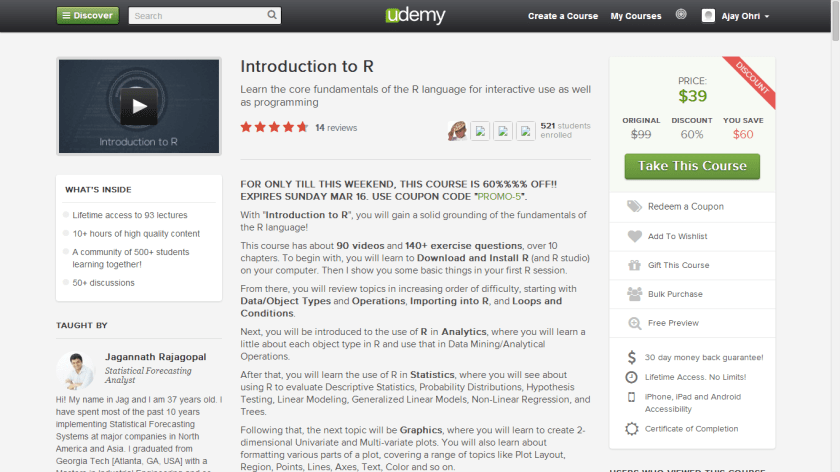
Learn R for just a few dollars using Udemy #rstats

FOR ONLY TILL THIS WEEKEND, THIS COURSE IS 60%%%% OFF!! EXPIRES SUNDAY MAR 16. USE COUPON CODE “PROMO-5”.

https://www.udemy.com/introduction-to-r/?couponCode=PROMO-5

90 videos and 140+ exercise questions, over 10 chapters

Screenshot 2014-03-15 22.46.59

R packages for Pharma and Medicine #rstats

There is a dedicated CRAN task view on the various options within the R ecosystem for Clinical Trails

CRAN Task View: Clinical Trial Design, Monitoring, and Analysis http://cran.r-project.org/web/views/ClinicalTrials.html This task view gathers information on specific R packages for design, monitoring and analysis of data from clinical trials. It focuses on including packages for clinical trial design and monitoring in general plus data analysis packages for a specific type of design. Also, it gives a brief introduction to important packages for analyzing clinical trial data . It has the following sub headings.


  1. Design and Monitoring
  2. Design and Analysis
  3. Analysis for Specific Designs
  4. Analysis in General
  5. Meta-Analysis


 and an additional one on PharmaKinetic Data

CRAN Task View: Analysis of Pharmacokinetic Data http://cran.r-project.org/web/views/Pharmacokinetics.html The primary goal of pharmacokinetic (PK) data analysis is to determine the relationship between the dosing regimen and the body’s exposure to the drug as measured by the nonlinear concentration time curve or related summaries (e.g. the area under the curve). Base R contains nls which can be used to calculate nonlinear least-squares estimates of the parameters from a PK model. It returns an object of the class "nls" having methods coef(),formula(), resid(), print(), summary(), AIC(), fitted() and vcov(). Four packages are available in CRAN that directly aid in PK data analysis, including; the packages PK, PKfit, nlmeODE which incorporates nlme and deSolve, and the package PKtools. While PK provides basic pharmacokinetics functions which implement non-compartmental analysis methods, the latter three packages focus on modeling methods.

A relatively new [package] is Greport

http://biostat.mc.vanderbilt.edu/wiki/Main/Greport The greport package contains many functions useful for monitoring and reporting the results of clinical trials and other experiments in which treatments are compared. LaTeX is used to typeset the resulting reports, recommended to be in the context of knitr. The Hmisc and lattice packages are used by greport for high-level graphics.

(NOTE- I wish there was some way to group packages and functions along business domains like finance, telecom, pharma, retail , entertainment) the current system of CRAN views is purely a clustering of packages of similar techniques but not business domains)

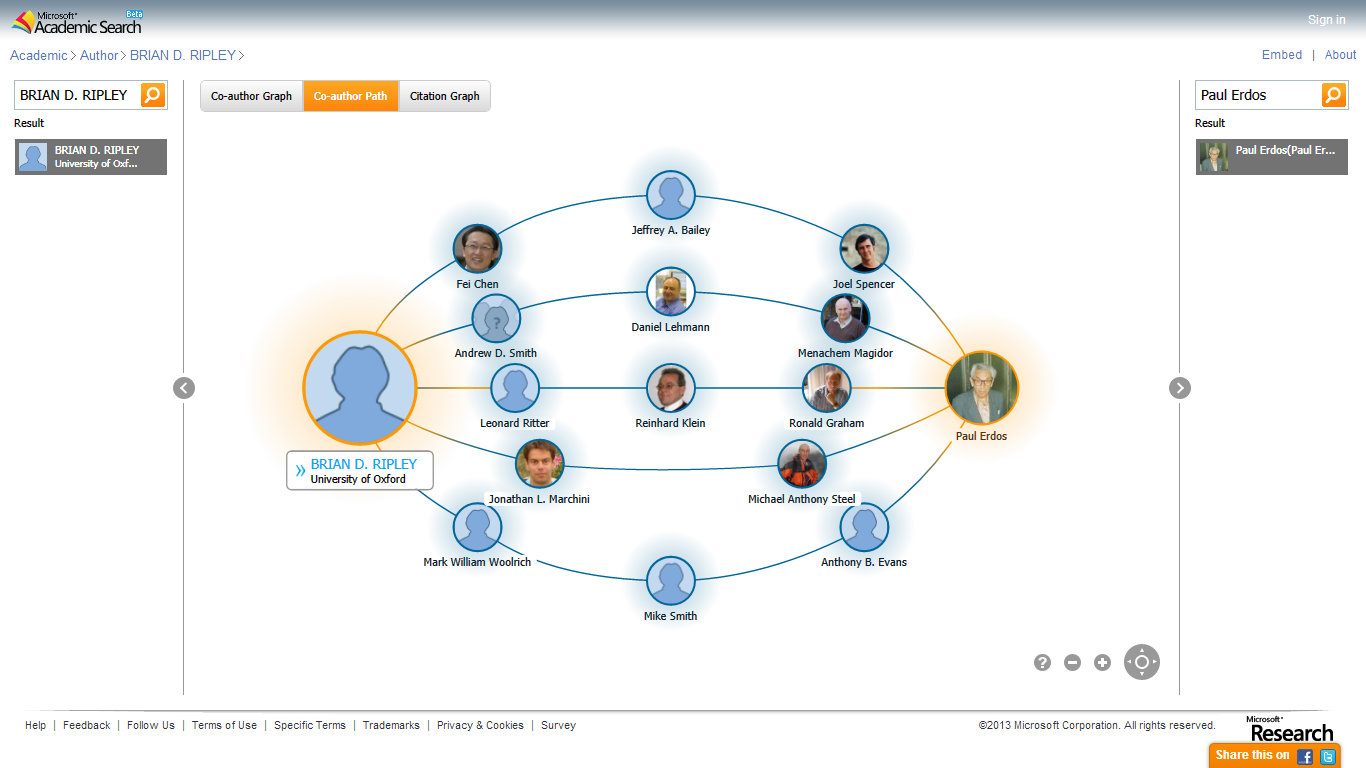
What is your Erdos number #rstats

Nice tool here courtesy Microsoft

What is Erdos Number

The Erdős number (Hungarian pronunciation: [ˈɛrdøːʃ]) describes the “collaborative distance” between a person and mathematician Paul Erdős, as measured by authorship of mathematical papers.

The same principle has been proposed for other eminent people in other fields.

http://academic.research.microsoft.com/VisualExplorer#486937&1112639

1

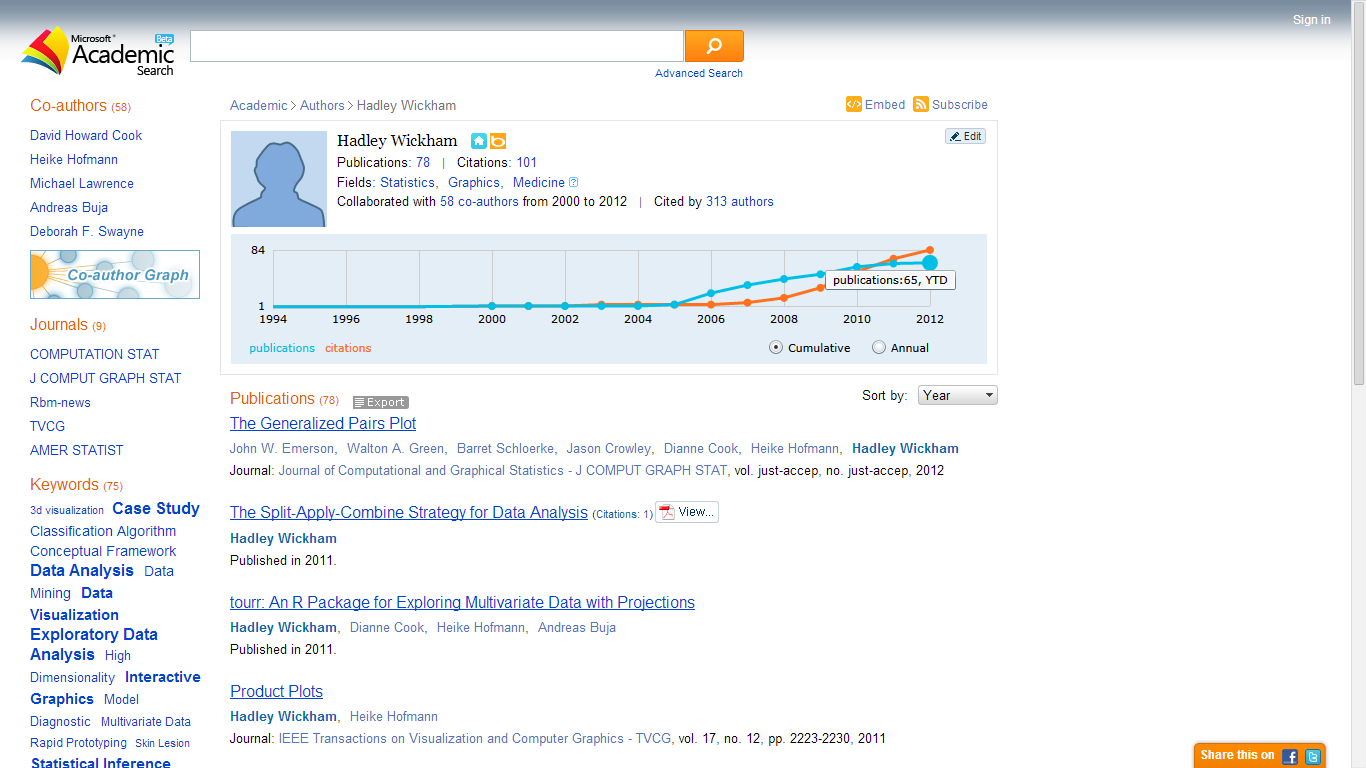
Here are two of them-

you can see how prolific Hadley and Ripley are

http://academic.research.microsoft.com/Author/2867732/hadley-wickham


2

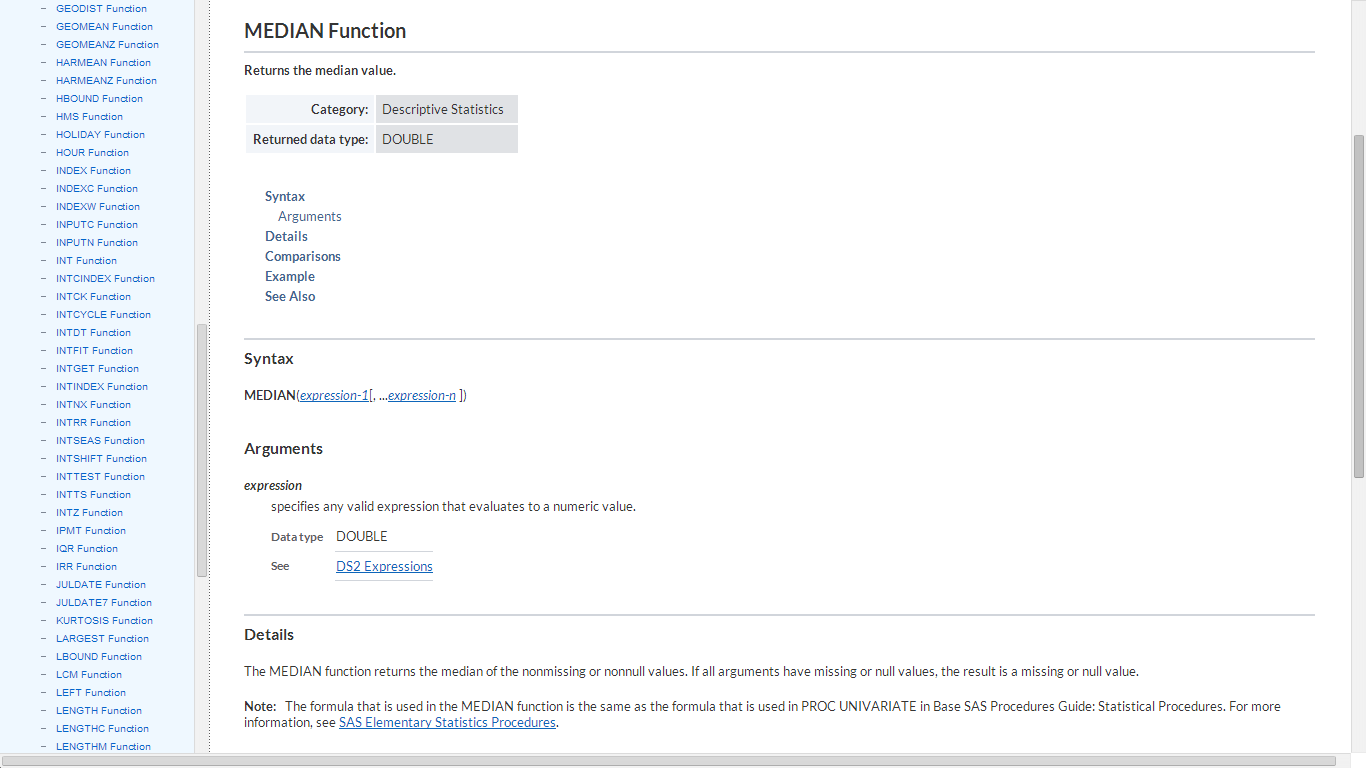
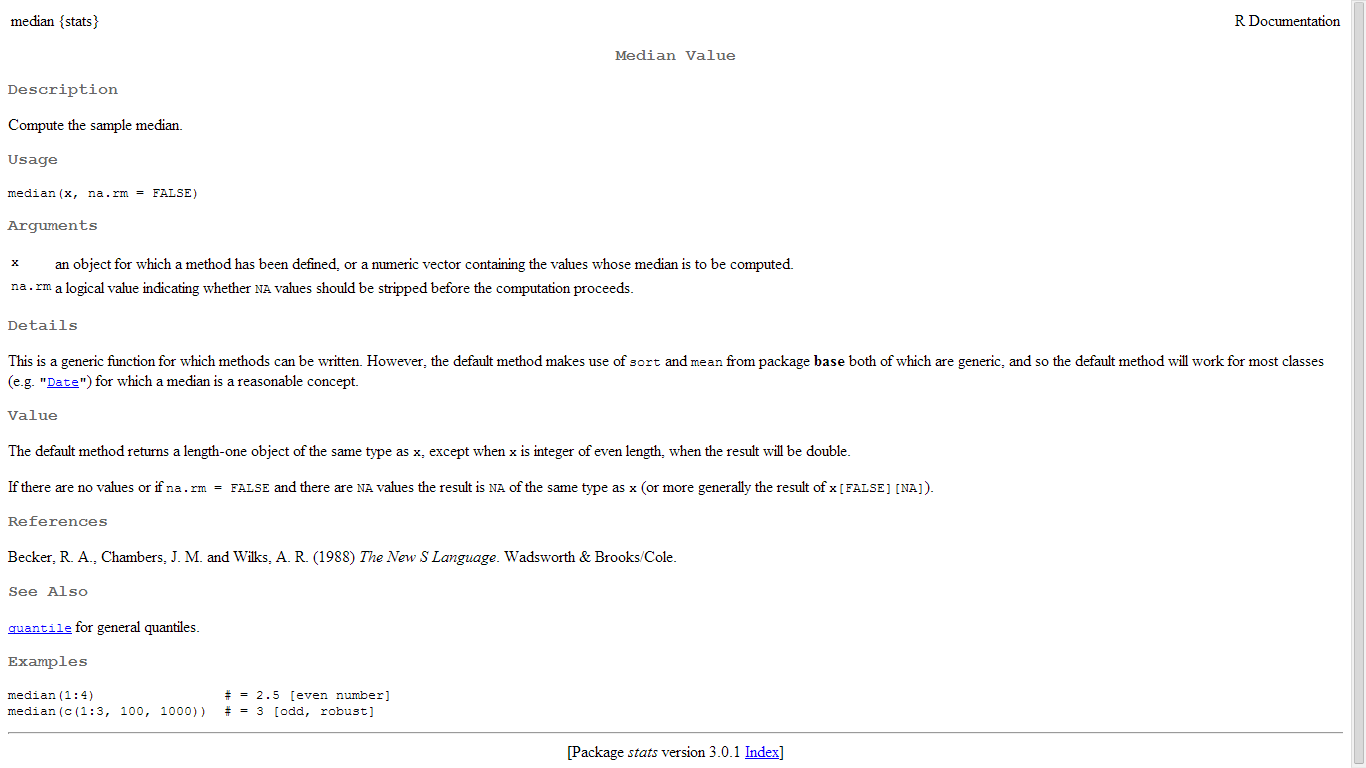
A tale of two documentation #SAS #Rstats #Language

A very basic example of why R Documentation is “expert friendly” while SAS language documentation is “user friendly”

Screenshot 2014-03-03 16.01.42

From- a Quora thread  Screenshot 2014-03-03 16.01.57


New Delhi R User Group goes 200+

The New Delhi R User Group  has now 218 members. We have been meeting regularly since Ocr 2012, and last year we even took Revolution’s generous offer of basic sponsorship with an application this year for a higher level sponsorship.

Meetups are something are new here. We are looking to expand the analytics open source ecosystem here in India- and we welcome any analytics company near NCR area willing to donate office space in Gurgaon , Noida, Delhi once a month to host us.

It is great to see the energy of the next analytics  generation and I feel honored to be surrounded by so many bright and young engineers.

related- http://www.revolutionanalytics.com/r-user-group-sponsorship-program

ndm

GUIDE- a great GUI for derivatives in #rstats

I was reading a review copy of this fine book ” R for Quantitative Finance” when I came across a GUI for Finance in R – its called the GUIDE package and it’s absolutely is a must for people wanting to try out R based Quant Finance for a risk free trial 😉


I think it can be used to further spread R in the area of teaching finance courses.

See it yourself-

http://cran.r-project.org/web/packages/GUIDE/index.html