Running R on Windows Azure #rstats #cloud

Here is a brief tutorial for people to run R on Windows Azure Cloud (OS=Windows in this case , but there are 4 kinds of Linux also available)

There is a free 90 day trial so you can run R for free on the cloud for free (since Google Cloud Compute is still in closed hush hush beta)

Go to https://www.windowsazure.com/en-us/pricing/free-trial/

Book Review- Machine Learning for Hackers

This is review of the fashionably named book Machine Learning for Hackers by Drew Conway and John Myles White (O’Reilly ). The book is about hacking code in R.


The preface introduces the reader to the authors conception of what machine learning and hacking is all about. If the name of the book was machine learning for business analytsts or data miners, I am sure the content would have been unchanged though the popularity (and ambiguity) of the word hacker can often substitute for its usefulness. Indeed the many wise and learned Professors of statistics departments through out the civilized world would be mildly surprised and bemused by their day to day activities as hacking or teaching hackers. The book follows a case study and example based approach and uses the GGPLOT2 package within R programming almost to the point of ignoring any other native graphics system based in R. It can be quite useful for the aspiring reader who wishes to understand and join the booming market for skilled talent in statistical computing.

Chapter 1 has a very useful set of functions for data cleansing and formatting. It walks you through the basics of formatting based on dates and conditions, missing value and outlier treatment and using ggplot package in R for graphical analysis. The case study used is an Infochimps dataset with 60,000 recordings of UFO sightings. The case study is lucid, and done at a extremely helpful pace illustrating the powerful and flexible nature of R functions that can be used for data cleansing.The chapter mentions text editors and IDEs but fails to list them in a tabular format, while listing several other tables like Packages used in the book. It also jumps straight from installation instructions to functions in R without getting into the various kinds of data types within R or specifying where these can be referenced from. It thus assumes a higher level of basic programming understanding for the reader than the average R book.

Chapter 2 discusses data exploration, and has a very clear set of diagrams that explain the various data summary operations that are performed routinely. This is an innovative approach and will help students or newcomers to the field of data analysis. It introduces the reader to type determination functions, as well different kinds of encoding. The introduction to creating functions is quite elegant and simple , and numerical summary methods are explained adequately. While the chapter explains data exploration with the help of various histogram options in ggplot2 , it fails to create a more generic framework for data exploration or rules to assist the reader in visual data exploration in non standard data situations. While the examples are very helpful for a reader , there needs to be slightly more depth to step out of the example and into a framework for visual data exploration (or references for the same). A couple of case studies however elaborately explained cannot do justice to the vast field of data exploration and especially visual data exploration.

Chapter 3 discussed binary classification for the specific purpose for spam filtering using a dataset from SpamAssassin. It introduces the reader to the naïve Bayes classifier and the principles of text mining suing the tm package in R. Some of the example codes could have been better commented for easier readability in the book. Overall it is quite a easy tutorial for creating a naïve Bayes classifier even for beginners.

Chapter 4 discusses the issues in importance ranking and creating recommendation systems specifically in the case of ordering email messages into important and not important. It introduces the useful grepl, gsub, strsplit, strptime ,difftime and strtrim functions for parsing data. The chapter further introduces the reader to the concept of log (and affine) transformations in a lucid and clear way that can help even beginners learn this powerful transformation concept. Again the coding within this chapter is sparsely commented which can cause difficulties to people not used to learn reams of code. ( it may have been part of the code attached with the book, but I am reading an electronic book and I did not find an easy way to go back and forth between the code and the book). The readability of the chapters would be further enhanced by the use of flow charts explaining the path and process followed than overtly verbose textual descriptions running into multiple pages. The chapters are quite clearly written, but a helpful visual summary can help in both revising the concepts and elucidate the approach taken further.A suggestion for the authors could be to compile the list of useful functions they introduce in this book as a sort of reference card (or Ref Card) for R Hackers or atleast have a chapter wise summary of functions, datasets and packages used.

Chapter 5 discusses linear regression , and it is a surprising and not very good explanation of regression theory in the introduction to regression. However the chapter makes up in practical example what it oversimplifies in theory. The chapter on regression is not the finest chapter written in this otherwise excellent book. Part of this is because of relative lack of organization- correlation is explained after linear regression is explained. Once again the lack of a function summary and a process flow diagram hinders readability and a separate section on regression metrics that help make a regression result good or not so good could be a welcome addition. Functions introduced include lm.

Chapter 6 showcases Generalized Additive Model (GAM) and Polynomial Regression, including an introduction to singularity and of over-fitting. Functions included in this chapter are transform, and poly while the package glmnet is also used here. The chapter also introduces the reader formally to the concept of cross validation (though examples of cross validation had been introduced in earlier chapters) and regularization. Logistic regression is also introduced at the end in this chapter.

Chapter 7 is about optimization. It describes error metric in a very easy to understand way. It creates a grid by using nested loops for various values of intercept and slope of a regression equation and computing the sum of square of errors. It then describes the optim function in detail including how it works and it’s various parameters. It introduces the curve function. The chapter then describes ridge regression including definition and hyperparameter lamda. The use of optim function to optimize the error in regression is useful learning for the aspiring hacker. Lastly it describes a case study of breaking codes using the simplistic Caesar cipher, a lexical database and the Metropolis method. Functions introduced in this chapter include .Machine$double.eps .

Chapter 8 deals with Principal Component Analysis and unsupervised learning. It uses the ymd function from lubridate package to convert string to date objects, and the cast function from reshape package to further manipulate the structure of data. Using the princomp functions enables PCA in R.The case study creates a stock market index and compares the results with the Dow Jones index.

Chapter 9 deals with Multidimensional Scaling as well as clustering US senators on the basis of similarity in voting records on legislation .It showcases matrix multiplication using %*% and also the dist function to compute distance matrix.

Chapter 10 has the subject of K Nearest Neighbors for recommendation systems. Packages used include class ,reshape and and functions used include cor, function and log. It also demonstrates creating a custom kNN function for calculating Euclidean distance between center of centroids and data. The case study used is the R package recommendation contest on Kaggle. Overall a simplistic introduction to creating a recommendation system using K nearest neighbors, without getting into any of the prepackaged packages within R that deal with association analysis , clustering or recommendation systems.

Chapter 11 introduces the reader to social network analysis (and elements of graph theory) using the example of Erdos Number as an interesting example of social networks of mathematicians. The example of Social Graph API by Google for hacking are quite new and intriguing (though a bit obsolete by changes, and should be rectified in either the errata or next edition) . However there exists packages within R that should be atleast referenced or used within this chapter (like TwitteR package that use the Twitter API and ROauth package for other social networks). Packages used within this chapter include Rcurl, RJSONIO, and igraph packages of R and functions used include rbind and ifelse. It also introduces the reader to the advanced software Gephi. The last example is to build a recommendation engine for whom to follow in Twitter using R.

Chapter 12 is about model comparison and introduces the concept of Support Vector Machines. It uses the package e1071 and shows the svm function. It also introduces the concept of tuning hyper parameters within default algorithms . A small problem in understanding the concepts is the misalignment of diagram pages with the relevant code. It lastly concludes with using mean square error as a method for comparing models built with different algorithms.


Overall the book is a welcome addition in the library of books based on R programming language, and the refreshing nature of the flow of material and the practicality of it’s case studies make this a recommended addition to both academic and corporate business analysts trying to derive insights by hacking lots of heterogeneous data.

Have a look for yourself at-
http://shop.oreilly.com/product/0636920018483.do

Using R for Cloud Computing – made very easy and free by BioConductor

I really liked the no hassles way Biocnoductor has put a cloud AMI loaded with RStudio to help people learn R, and even try using R from within a browser in the cloud.

Not only is the tutorial very easy to use- they also give away 2 hours for free computing!!!

Check it out-

Step 1

Step 2

Step 3

and wow! I am using Google Chrome to run R ..and its awesome!

Interesting- check out two hours for free — all you need is a browser and internet connection

http://www.bioconductor.org/help/cloud/

How to use Bit Torrents

I really liked the software Qbittorent available from http://www.qbittorrent.org/ I think bit torrents should be the default way of sharing huge content especially software downloads. For protecting intellectual property there should be much better codes and software keys than presently available.

The qBittorrent project aims to provide a Free Software alternative to µtorrent. Additionally, qBittorrent runs and provides the same features on all major platforms (Linux, Mac OS X, Windows, OS/2, FreeBSD).

qBittorrent is based on Qt4 toolkit and libtorrent-rasterbar.

qBittorrent v2 Features

  • Polished µTorrent-like User Interface
  • Well-integrated and extensible Search Engine
    • Simultaneous search in most famous BitTorrent search sites
    • Per-category-specific search requests (e.g. Books, Music, Movies)
  • All Bittorrent extensions
    • DHT, Peer Exchange, Full encryption, Magnet/BitComet URIs, …
  • Remote control through a Web user interface
    • Nearly identical to the regular UI, all in Ajax
  • Advanced control over trackers, peers and torrents
    • Torrents queueing and prioritizing
    • Torrent content selection and prioritizing
  • UPnP / NAT-PMP port forwarding support
  • Available in ~25 languages (Unicode support)
  • Torrent creation tool
  • Advanced RSS support with download filters (inc. regex)
  • Bandwidth scheduler
  • IP Filtering (eMule and PeerGuardian compatible)
  • IPv6 compliant
  • Sequential downloading (aka “Download in order”)
  • Available on most platforms: Linux, Mac OS X, Windows, OS/2, FreeBSD
So if you are new to Bit Torrents- here is a brief tutorial
Some terminology from

Tracker

tracker is a server that keeps track of which seeds and peers are in the swarm.

Seed

Seed is used to refer to a peer who has 100% of the data. When a leech obtains 100% of the data, that peer automatically becomes a Seed.

Peer

peer is one instance of a BitTorrent client running on a computer on the Internet to which other clients connect and transfer data.

Leech

leech is a term with two meanings. Primarily leech (or leeches) refer to a peer (or peers) who has a negative effect on the swarm by having a very poor share ratio (downloading much more than they upload, creating a ratio less than 1.0)
1) Download and install the software from  http://www.qbittorrent.org/
2) If you want to search for new files, you can use the nice search features in here
3) If you want to CREATE new bit torrents- go to Tools -Torrent Creator
4) For sharing content- just seed the torrent you just created. What is seeding – hey did you read the terminology in the beginning?
5) Additionally –
From

Trackers: Below are some popular public trackers. They are servers which help peers to communicate.

Here are some good trackers you can use:


http://open.tracker.thepiratebay.org/announce
http://www.torrent-downloads.to:2710/announce
http://denis.stalker.h3q.com:6969/announce
udp://denis.stalker.h3q.com:6969/announce
http://www.sumotracker.com/announce

and

Super-seeding

When a file is new, much time can be wasted because the seeding client might send the same file piece to many different peers, while other pieces have not yet been downloaded at all. Some clients, like ABCVuzeBitTornado, TorrentStorm, and µTorrent have a “super-seed” mode, where they try to only send out pieces that have never been sent out before, theoretically making the initial propagation of the file much faster. However the super-seeding becomes less effective and may even reduce performance compared to the normal “rarest first” model in cases where some peers have poor or limited connectivity. This mode is generally used only for a new torrent, or one which must be re-seeded because no other seeds are available.
Note- you use this tutorial and any or all steps at your own risk. I am not legally responsible for any mishaps you get into. Please be responsible while being an efficient bit tor renter. That means respecting individual property rights.

Topic Models

Some stuff on Topic Models-

http://en.wikipedia.org/wiki/Topic_model

In machine learning and natural language processing, a topic model is a type of statistical model for discovering the abstract “topics” that occur in a collection of documents. An early topic model was probabilistic latent semantic indexing (PLSI), created by Thomas Hofmann in 1999.[1] Latent Dirichlet allocation (LDA), perhaps the most common topic model currently in use, is a generalization of PLSI developed by David Blei, Andrew Ng, and Michael Jordan in 2002, allowing documents to have a mixture of topics.[2] Other topic models are generally extensions on LDA, such as Pachinko allocation, which improves on LDA by modeling correlations between topics in addition to the word correlations which constitute topics. Although topic models were first described and implemented in the context of natural language processing, they have applications in other fields such as bioinformatics.

http://en.wikipedia.org/wiki/Latent_Dirichlet_allocation

In statistics, latent Dirichlet allocation (LDA) is a generative model that allows sets of observations to be explained by unobserved groups that explain why some parts of the data are similar. For example, if observations are words collected into documents, it posits that each document is a mixture of a small number of topics and that each word’s creation is attributable to one of the document’s topics. LDA is an example of a topic model

David M Blei’s page on Topic Models-

http://www.cs.princeton.edu/~blei/topicmodeling.html

The topic models mailing list is a good forum for discussing topic modeling.

In R,

Some resources I compiled on Slideshare based on the above- Continue reading “Topic Models”

UseR goes to Nashville, USA

So if Vanderbilt did lose (again) to UT (http://www.govolsxtra.com/news/2011/nov/20/video-tennessee-highlights-vanderbilt-game/) , they have somethign better to look before next season’s football season.

UseR is coming to Tennessee in 2012! This is the premier conference happens annually for R language (>2 mill users), and alternated between Europe and North America every other year.

Details here

http://biostat.mc.vanderbilt.edu/wiki/Main/UseR-2012

useR! 2012 (12-15 June 2012)
Department of Biostatistics
Vanderbilt University
School of Medicine
Nashville Tennessee USA


Pre-conference Survey

If you plan to attend useR! 2012, help us plan by completing a RedCAP Survey.


Contact

Stephania McNeal-Goddard
Assistant to the Chair
stephania.mcneal-goddard@vanderbilt.edu
Phone:             615.322.2768
Fax: 615.343.4924
Vanderbilt University School of Medicine
Department of Biostatistics
S-2323 Medical Center North
Nashville, TN 37232-2158


Abstracts and Tutorial Proposals

Participants are encouraged to submit an abstract to for oral presentation during a Kaleidoscope or Focus session, or for poster presentation. Tutorial proposals are also welcomed.

Deadlines

  • Tutorial Submission: Dec 1 – Jan 31
  • Tutorial Acceptance Notification: Feb 1 – Feb 29
  • Abstract Submission: Dec 1 – Mar 12
  • Abstract Acceptance Notification: Mar 13 – Apr 15


Registration


Deadlines

  • Early Registration: Jan 1 – Feb 29
  • Regular Registration: Mar 1 – May 12
  • Late Registration: May 13 – June 11
  • On-site Registration: June 12 – June 15


Travel and Lodging Information

Vanderbilt University is located in Nashville, Tennessee, USA.

Air Travel

The nearest major airport to Vanderbilt University is the Nashville International Airport (BNA). The airport is about 10 miles east of the campus and downtown Nashville. The BNA website maintains a list of ground transportation options for air travelers. The approximate taxi fare from the airport to Vanderbilt University is $27. Shuttles and buses are also available from the airport. The latter is economical (approximate fare is $1.60), but the travel time is more than an hour.

Car Travel

Nashville is located at the intersection of three major interstates. Interstate 40 approaches from the east and west, interstate 24 from the northwest and southeast, and interstate 65 from the northeast and south.

Using R with MySQL #rstats

A brief tutorial to working with R and MySQL. MySQL belongs to Oracle is one of the most widely used databases now.

1. Download mySQL from
http://www.mysql.com/downloads/mysql/  or (http://www.mysql.com/downloads/mirror.php?id=403831)
Click Install -use default options, remember to note down the password=XX
2.Download the ODBC connector from http://www.mysql.com/downloads/connector/odbc/5.1.htmlThe Data Sources (ODBC) can be located from the Control Panel in Windows7

Install ODBC Connector by double clicking the .msi file downloaded in Step 2-
Check this screenshot in ODBC Connectors to verify-
Note this is the Drivers tab in ODBC Data Source Administrator
Click the System DSN and Configure MySQL using the add button 
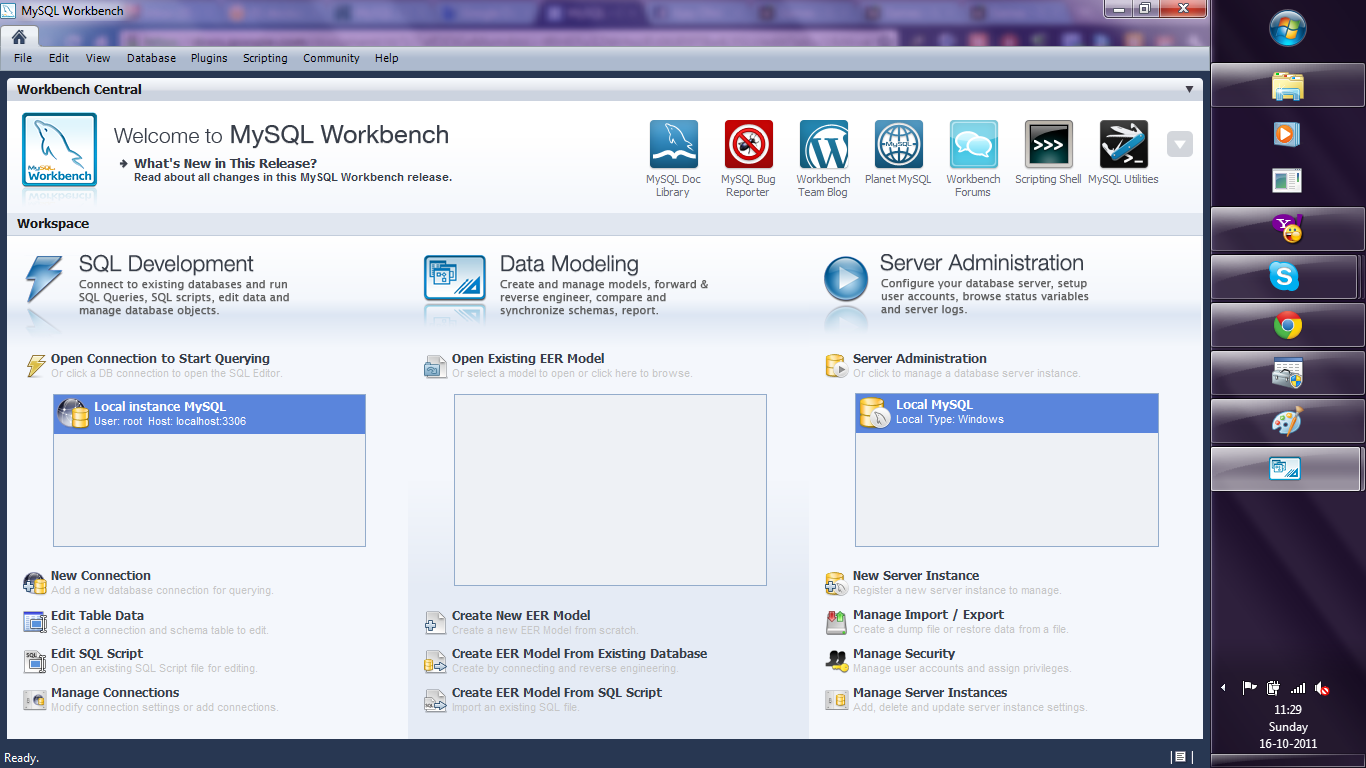
Use the configuration options shown exactly here. The user is root, the TCP/IP Server is local host, use the same password in Step 1 and the Database is MySQL
Test the connection

Click OK to finish this step.
Click the User DSN tab (and repeating the step  immediately above -Add, and Configure the connection using options The user is root, the TCP/IP Server is local host, use the same password in Step 1 and the Database is MySQL , Test the connection and OK to add the connection

3. Download the MySQL workbench from http://www.mysql.com/downloads/workbench/

This is very helpful to configuring the database
http://www.mysql.com/downloads/mirror.php?id=403983#mirrors

Create a new table using the options in the screenshots below

Open Connection

You can create a new table using the options as below,
Once created you can also add new variables (using the Columns Tab)

MySQL allows you create new columns very easily
The  SQL commands are automatically generated.
Click Apply  to execute the changes to the Database.

Now we start R
Type the commands in the screenshot below to create a connection to the Database in MySQL
> library(RODBC)
> odbcDataSources()
> ajay=odbcConnect(“MySQL”,uid=”root”,pwd=”XX”)
> ajay
> sqlTables(ajay)
>tested=sqlFetch(ajay,”host”)

Note- this is a brief tutorial for beginners without getting into too many complexities of database administration and management, to start using R and MySQL.