2) The Reserve bank of India choose Business Objects and gives you a proper drilldown kind of graph and tables. ( thats a lot of heavy metal and iron ore China needs from India 😉 😉
You can see the screenshots of the various visualization tools of the New York Fed Reserve Bank and Indian Reserve Bank- if the US Fed is serious about cutting the debt maybe it should start publishing better visuals
In a world of experts-some questions to ask about China’s foreign policy , trade and military convergence
1) How can an increasingly rich 1.2 billion people accept a restricted internet, one child policies, and severe political restrictions/
2) How long can the Chinese respect for elders and ancestors be translated to a respect for the communist government? How do you measure the level of satisfaction?
3) Can ambitious Chinese Mandarins be motivated by career motives to act tougher than the country’s national interest demands?
4) Rare earth demand and supply curves? Clean energy investments versus climate change commitments graph?
5)Military- Metrics like Chinese Air Force flying hours per pilot, or submarine activity per annum?
As the Chinese supposedly said- May you live in interesting times
shows that while US added 600 billion of debt during the past one year, the Chinese actually reduced their exposure by 50 billion Dollars.
so who has been financing the debt for the US for the past one year- It is Japan- eager to keep its currency down and United Kingdom which has pumped in an extra 300 billion of T Bills.
See the whole table at official link above or at goo.gl/qMugp
—————————————————————————————-
China still remembers the Opium Wars in which the then ruling Anglo Saxon superpower used naval superiority to enforce trade and eventual political dependency. Is China unsure of the United States brotherly nice intentions? They certainly seem to be putting their money that way.
Britain forced the Chinese government into signing theTreaty of Nanking and the Treaty of Tianjin, also known as the Unequal Treaties, which included provisions for the opening of additional ports to unrestricted foreign trade, for fixed tariffs; for the recognition of both countries as equal in correspondence; and for the cession of Hong Kong to Britain. The British also gained extraterritorial rights. Several countries followed Britain and sought similar agreements with China. Many Chinese found these agreements humiliating and these sentiments contributed to the Taiping Rebellion (1850–1864), the Boxer Rebellion (1899–1901), and the downfall of the Qing Dynasty in 1912, putting an end to dynastic China.
———————————————————————————————-
The Koreans can always be depended on provide the first shot in any conflict- and though Anglo-US-Chinese conflict would be expensive- I guess as long as the cost of outstanding debt with China is less than cost of a brief -techno-war , we would see interesting games in this neighborhood. Note China restricts major trade with United States particularly in software, internet services (like Web Advertising, Facebook, Twitter ) and represents a lucrative market for big pharma (especially in psychiatric drugs) and big tech once it reforms its intellectual property rights. Software would be the opium of the 21st Century- if Chinese resist the Treasury Bills as their poppy flowers. The widespread Western media coverage of school kids murders by pyschopaths is also a trade tactic to encourage flow of more US made medicine in the Chinese market.
It would also help create an economic revival in the United States to exaggerate the Chinese threat (remember Sputnik) and build up its own cyber spending. Any military or cyber humiliation for the ruling party in China can help create a political vacuum for more malleable and agreeable alternatives to emerge.
Yup Yankee Doodle. Welcome to India. Ancient Land of Mystique. Modern Land of taking your job.
Let me give you how many jobs we created in India from you.
“Generation of employment
The rapid growth in IT-BPO industry has created large number of jobs for the expanding employablepopulation. The employment provided by the industry increased more than 8 times over FY2000-2009and reached 2.2 million in FY2009.”
6. Foreign trade grew rapidly and trade surplus was reduced to some extent. The total value of imports and exports for the first three quarters of this year was US$ 2,148.7 billion, up by 37.9 percent year-on-year. The value of exports was US$ 1,134.6 billion, up by 34.0 percent, and the value of imports was US$ 1,014.0 billion, up by 42.4 percent. The trade surplus was US$ 120.6 billion, a decline of US$ 14.9 billion over the same period last year.”
Thats a lot of money employing a lot of Chinese, maybe even more than the 1 million American jobs that went to India.
The computers, electronic equipment, and parts industries experienced the largest growth in trade deficits with China, leading with 627,700 (26%) of all jobs displaced between 2001 and 2008. As a result, the hardest hit Congressional districts were located in California and Texas, where remaining jobs in those industries are concentrated, and in North Carolina, which was hard hit by job displacement in a variety of manufacturing industries
NOTE- Thats also a very sensitive area in terms of security cyber et all
Anyways, thats all now. Thanks for the jobs Yankee boys
(written by an Indian who dislikes job losses anywhere)
China could be the biggest threat to India in next five years, positioning itself as the lowest-cost manpower supplier in the IT sector by 2015, according to Mr Vineet Nayar, CEO, HCL Technologies.
“I believe it (China) is the biggest threat in the next five years that we are going to face…So India will have to up its game,” he told reporters on sidelines of ‘Directions’, the company’s annual town hall.
Terming China, as both “threat and opportunity”, Mr Nayar said that India will have to find alternate “differentiators” than the ones it currently has. Despite issues of language and the purported inability to scale-up, China has sharpened its technological and innovation edge, he added.
“Look at the technology companies from China…how does that fit in with the assumption that they (China) do not understand English or technology. They are producing cutting edge technology at a price which is lower than everyone else,” he said.
Manpower
By 2015, Mr Nayar said, China will be the lowest cost manpower supplier in IT sector to the world
——————————————————————————————–
I wonder how he did his forecast. Did he do a time series analysis using a software, did he peer into his crystal ball, or did he spend a lot of time brainstorming with his strategic macro economic team on Chinese threat.
China has various advantages over India (and in fact the US)-
1) Big pool of reliable scientific manpower
2) State funded education in higher studies and STEM
3) Increasing exposure with the West-English speaking is no longer an issue. Almost 50 % of Grad Students in the US in STEM and certain sectors are Chinese and they not only retain fraternal ties with the motherland- they often remain un-assimilated with American Culture mainstream. or they have a separate interaction with fellow American Chinese and seperate with American Americans.
Chinese suffer from some disadvantages in software-
1) Communism Perception- Just because the Govt is communist and likes to confront US once a year (and India twice a month)- is no excuse for the hapless Chinese startup guy to lose out on software outsourcing contracts. unfortunately there have been reported cases where sneak codes have been inserted in code deliverables for American partners, just like American companies are forced to work with DoD (especially in software, embedded chips and telecom)
If you have 10000 lines of code delivered by your Chinese partner, how sure are you of going through each line of code for each sub routine or call procedure.
2) English- Chinese accent is like Chinese cooking. Unique- many Chinese are unable to master the different style of English even after years (derived from Latin and Indo European class of languages)
Sales jobs tend to go to American trained Chinese or to Westerners.
In Indian software companies, accent is a lesser problem.
———————————————————————————-
The biggest threat to Indian software in 5 years is actually Indian software itself- Can it evolve and mature to a product based model from a service only model.
Can Indian software partner with Chinese companies and maybe teach the Indian government why friendship is more profitable than envy and suspicion. If the US and China can trade enormously despite annual tensions, why cant Indian services do the same- if they lose this opportunity, US companies will likely bypass them and create the same GE/McKinsey style backoffices that started the Indian offshoring phenomenon.
3) Lastly- what did the poor American grad student do to deserve that even if devotes years to study STEM (and being called a Geek and Nerd) his job will get outsourced to India or China (if not now- in his 30s or worse in his 40s). Talk to any middle aged IT chap in the US who is middle class- and India and China would figure in why he still worries about his overpriced mortgage.
Unless the US wants only Twitter and Facebook as dominant technologies in the 21 st century.
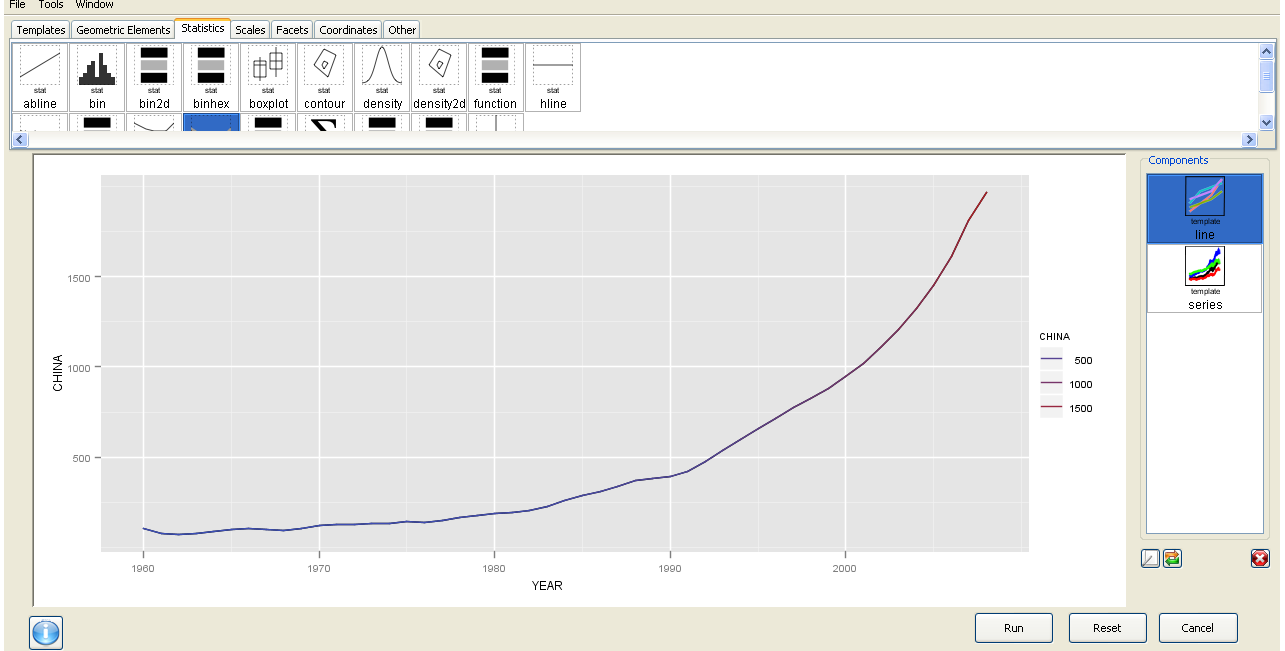
Now this is basic data manipulation- and I used Deducer for it.
The best thing is the ability to use GGPlot using a GUI.
I am now trying to create more complicated plots for example with more than one Y variable but it is still a work in progress. Overall Deducer has made impressive improvements and with the JGR GUI seems very very promising. The look and feel also shows a combination of features (from SPSS ‘s variable and data view)
And yes China overtook India in 1985. In GDP per capita. Sigh
GGPLot though overtook Excel graphics as well.
Here is a video which is much better than my screenshots


. Art by Tom G...")


